Trend displayer placed in a picture, allows to display the time flow of the values of objects. One trend is able to display values up to four objects.
The following figure shows an example of trend. Two red horizontal lines represents limits defined for the trend.

To create Trend displayer
- In the Drawing toolbar, click the button Trend
 .
. - Point the mouse cursor to the position of the first trend corner and click.
- Point the mouse cursor to the position of the diagonal trend corner and click.
The parameters for connecting the displayer are being configured in the palette Connect object through the following tabs:
Objects
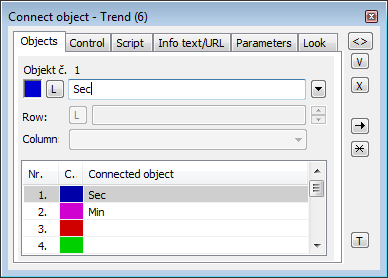
Object nr. 1 up to Object nr. 12
Each displayer of Trend type can display the values of as many as 12 objects. So the tab Objects contains input edit boxes allowing to define 12 objects. To define the objects to display in the displayer either enter its names or select them from a list opened by clicking the button placed right from the input box.
Color for displaying given object is defined by clicking the button placed left from the input box.
For object of Structured variable type, there must be defined column name (the parameter Column) and row number (the parameter Row). For object of Value array you must define a item (the button L), whose value will be displayed.
Control
The parameters placed on the tab are identical with the parameters on the tab Control of the Connect object palette.
Script
Reference variable
Specifies the name of the displayer in the form of reference variable for use in the picture script.
Metadata
Assignment of application data (metadata) to a graphic object. If the object contains some metadata, the name of the first record will be displayed in the button. Multiple records are indicated by ",...".
Event
The listbox allows user to select active picture event for the displayer. The listbox contains the following active picture events:
Event Handler
The button opens the active picture script to define the active picture event specified by the parameter Event.
Info text/URL
Info text
Text to display as a tooltip when user points the mouse cursor to the displayer in the picture opened in process D2000 HI.
Possibility to use the Dictionary (to open press CTRL+L).
URL
Definition of URL address to open a web page from a picture. The address may be set also in the picture script by the function %HI_SetOBJURL.
Parameters

Limits
Definition of limits of the trend. To define limits, it is necessary to check the button placed left. Then you can enter values of the limits. Clicking the color sample placed right opens the color palette to select the colors of the limits.
Y-range
Definition of a range of y-axis (vertical axis).
Length
The parameter defines the range of time axis (horizontal axis).
Shift
It defines a shift of time axis when drawing of flows reaches the right margin of time axis.
Thick lines
If the parameter is checked, flows displayed in the trend will be drawn by thick line.
Look
Appearance of the displayer is being configured in the tab Look.

Style
Definition of a style of the trend.
 | Trend is drawn with the frame and background. |
 | 3D effect - sunken trend. |
 | 3D effect - raised trend. |
 | Trend is drawn with 3D frame. |
Frame and Background
The parameters Frame and Background allows to define colors for the parts (frame and background) of the trend. Color is defined by selecting from the color palette opened by clicking the button placed right from the color sample of correspondent parameter.
Note relating to D2000 Thin Client
Trend displayer is not implemented in Thin Client.
For more rules see the page Drawing rules and object properties for D2000 Thin Client.
Related pages:
Pridať komentár