Graph window control
The following control buttons are located in the upper right corner of graph window. Displaying of buttons depends on the setting of specific user environment and specific application (see sections Console preferences a User preferences).
![]()
![]() V12.7N
V12.7N
In case of not using time zoom in the graph it is possible to move a time by set time interval directly with buttons with blue arrows.
If begin time is set on first day in month and end time is set on first day of next month, time interval will move by whole month.
![]()
![]() V12.7N
V12.7N
The value zoom is not located in the panel above graph window. Its controls can still be accessed by clicking the little yellow icon (with a plus sign in the middle), which appears on the left of y axis after the graph has been zoomed.

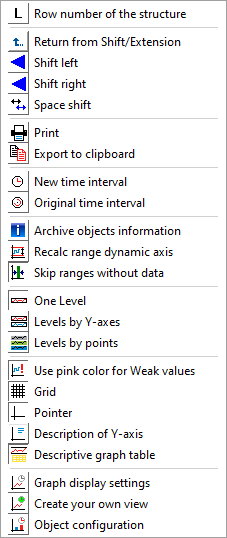
Meaning of the control buttons is listed in the table below.
 | Allows to define a row of all active graph objects in the graph (for active graphs only). |
| Returns to the previous time close-up view (time zoom) or previous y-axis range (value zoom). |
| View a previous time section (if there is no zoom) |
 | Moves y-axis one displayed range up. |
 | Moves y-axis one displayed range down. |
| Moves time axis one displayed time range left. |
| Moves time axis one displayed time range right. |
| Moves a time by set time interval left. |
| Moves a time by set time interval right. |
| Extend time by the time interval left. Interval size does not change with this action. |
| Extend time by the time interval right. Interval size does not change with this action. |
| Extend time by the time interval set by the previous zoom selection left. |
| Extend time by the time interval set by the previous zoom selection right. |
| Space shift mode - the way to work with the displayed interval button is alternated with the Space expansion mode. |
| Space expansion mode - the way to work with the displayed interval button is alternated with the Space shift mode. |
| Prints the graph window. |
| Exports text values of flows into Clipboard. |
| Allows to define a time interval to display values. |
| Returns to the initial time interval (when you defined a new time interval). |
| Shows information on archive objects in the graph. |
| Disables the automatic time shift of y-axis (time axis). |
| Calculates the dynamic axes range. |
| Enables / disables to draw the spaces without data. |
| Displays all graphs in one level. |
| Displays graphs in axis levels. |
| Displays graphs in object levels. |
| Enables / disables the coloured differentiation of weak (suspicious) values - pink color. |
| Shows/hides the auxiliary grid. |
| Shows/hides the pointer. |
| Shows / hides a description of y-axis. |
| Shows/hides the table in the graph window. If you press CTRL key together with the clicking this button, a rule for hiding the table will be changed. It means, the table will hide after reducing the size of graph window. |
| Graph display settings. |
| Create your own view |
| Delete your own view |
| On-line graph configuration. |


The configuration of a graph - check box Control buttons as popup, enables to display the control buttons via popup menu instead of displaying the control panel in upper part of window. This menu opens after right clicking in the area for description of x/y-axis in graph. Popup menu is also accessible when the buttons in upper part are hide because of smaller graph window. The popup menu is not accessible if the control buttons are disabled in the graph or they are disabled by the function %HI_SetVisibleGraphControls.

Graph window allows to show the table of particular object's values. Select the Display Table item from the menu opened after right-click on an object name in the table displayed in the graph window – the Object column. For more information see the topic Viewing values from the graph in the table.
The menu contains next items to set the axis range assigned to object - the Change Axis Range item and to emphasise the flow of particular object - the Highlight the Line item. Highlighting may be only applied for flows on analogue axis.
Indicator in the upper left corner of the graph window  displays current position of the y-axis pointer. It is displayed only if the pointer is enabled.
Note
- Audible alert (beep) when using the time or the value zoom can be disabled - see the parameter group Graphs in the Console preferences (or User preferences) dialog box - the Beep on zoom option).
Requirements
| Minimum supported version | D2000 V12.7N |
Pridať komentár