Graph display settings
Clicking on the button
 Graph display settings in the graph window opens the dialog box allowing
the user to set appearance and parameters of graphic flows displayed in the
graph. The dialog box contains five tabs, which are identical with the tabs in the
dialog box Graph configuration,
but there are active only some of the parameters in the following tabs:
Graph display settings in the graph window opens the dialog box allowing
the user to set appearance and parameters of graphic flows displayed in the
graph. The dialog box contains five tabs, which are identical with the tabs in the
dialog box Graph configuration,
but there are active only some of the parameters in the following tabs:
Parameters
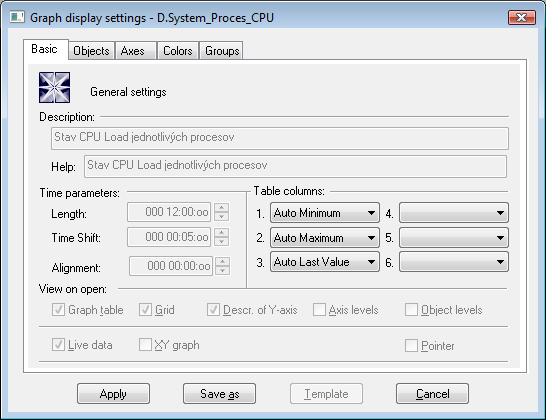
Table columns
The parameters allow to define the contents at most 6 columns of the graph table. There are the following options:
- Minimum - minimum object value within the time interval defined for the graph.
-
Auto Minimum - minimum object value within the time interval defined for the graph -
the column is visible only when graph displays the non-live data (the parameter Live data is not checked
or when user sets the past by button
 New time interval).
 - Maximum - maximum object value within the time interval defined for the graph.
-
Auto Maximum - maximum object value within the time interval defined for the graph
- the column is visible only when graph displays the non-live data (the parameter Live data is not checked
or when user sets the past by button
New time interval).
- Sum - sum of all valid object values within the time interval defined for the graph.
- Weighted Average - weighted average of all valid object values within the time interval defined for the graph.
- Arithmetic Average - arithmetic average of all valid object values within the time interval defined for the graph.
- Last Value - last object value.
- Auto Last Value - last object value - the column is visible only when graph displays the live data (the parameter Live data is checked) and graph changes because of new data are received.
- Universal - content of the column is defined by the parameter U.C. in the object configuration or the function %HI_SetGraphLineStat.
Note: For graphs containing live data (the parameter Live data is checked), there are evaluated all values within the time interval including last value. Last value of non-periodic data is not evaluated.
Objects
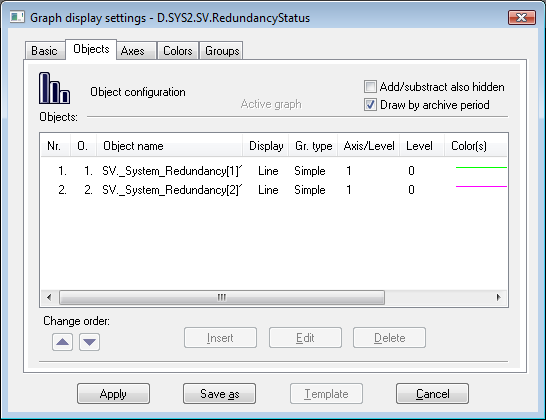
The list of object contains object name followed by graphic flow type with the mark of drawing mode in regard of zero value. Axis/Level column contains the axis number for drawing defined flow and, in case of digital axis, there is also assigned level of the axis. In the column Color(s) , there are displayed colors of drawing together with additional information (line type, pattern of flow area filling, selected mark,...).
Exceptions:
- Objects that are not used in graph (alternate objects (*)) and objects which have been deleted by script of picture are not shown in the list of object.
Note: The exceptions described above are relevant for configuration
performed through the dialog box opened by clicking the button
in graph window.
Change order
The buttons allows the user to change the order in the list - the buttons are not active.
Insert
It inserts a new object into the graph - the button is not active.
Edit
To edit the settings of an object, double-click the selected object, or click on the selected object and click the Edit button. It opens the dialog box Object configuration to edit the settings for displaying the object in the graph.
Delete
It deletes the selected objects - the button is not active.
Axes
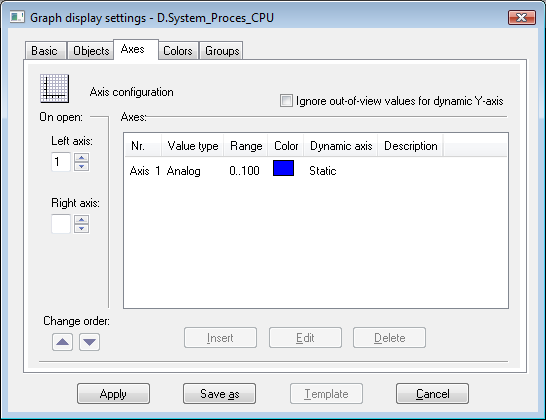
Ignore out-of-view values for dynamic Y-axis
If the parameter is checked, the range of the dynamic y-axis will be determined by the values within the time interval. If the parameter is not checked, the values out of defined time interval will also be taken into account.
Insert
It inserts a new object into the graph - the button is not active.
Edit
To edit the configuration of an axis click twice on the axis, or select the axis and click the button Edit. It opens the Axis configuration dialog box to edit the axis parameters.
Delete
It deletes the selected objects - the button is not active.
Related pages:
Pridať komentár