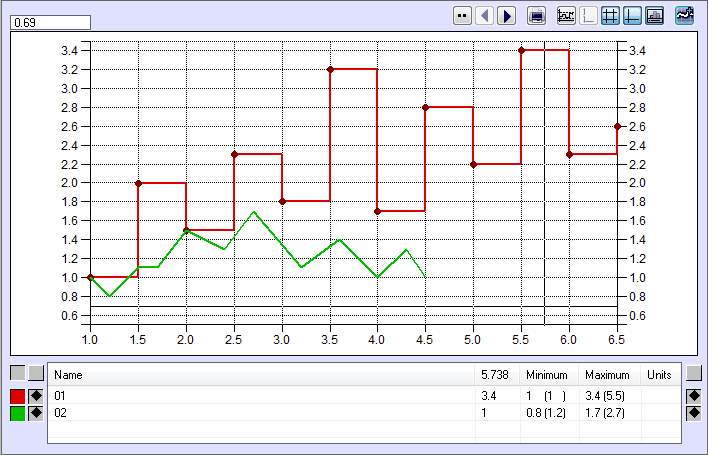
An example of XY graph window is shown in the following figure. Displaying each parts of the window depends on the user options and the size of the window.
Descriptive table of XY graph contains the following columns:
| Name | Name of graphic flow (see the parameter Description in the XY graph configuration). |
| Axis | Range of the y-axis (vertical
axis) assigned to the graphic flow. Note: The column is displayed in the table if there is defined more than one axis for the XY graph. |
| Position on x-axis | Position of the mouse pointer
according to the x-axis. Values in this column correspond to displayed
data on the x-axis. Note: The column is included in the table if the button - Pointer is pressed. |
| Minimum | Minimal value of the flow within the interval defined for the XY graph along with the position on the x-axis enclosed between brackets. |
| Maximum | Maximal value of the flow within the interval defined for the XY graph along with the position on the x-axis enclosed between brackets. |
| Units | Technical units of the flow (see the parameter Units in the XY graph configuration). |
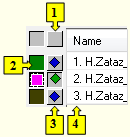
Color of the pair of the buttons (2 a 3) next to each table line corresponds to the graphic flow. These buttons perform the following functions. The left button (2) allows to show / hide the particular graphic flow. Right button (3) enables displaying the axis assigned to corresponding flow (vertical axis – y-axis). Buttons (1) near the table header are used to hide displaying the y-axis. The left button disables displaying the left axis and the right button hides displaying the right axis.
Right-clicking a flow displayed in the table opens the following popup menu:
Display table ...
Shows values from XY graph in table.
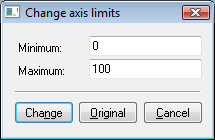
Change axis range ...
Allows to change the range of the y-axis assigned to given graphic flow. Clicking the item open the following dialog box to edit the axis range.
Highlight the line
The parameter allows to draw the line of double width.
Related pages:


Pridať komentár