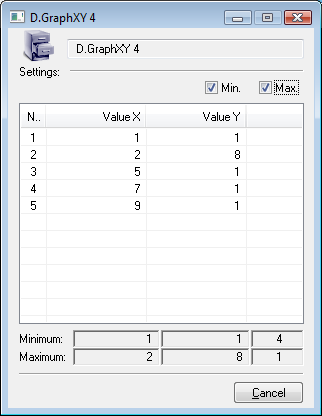
Viewing values from XY graph in table
Values of a graphic flow displayed in the XY graph window can be also shown in table form. The table shows a sequence of values in a text (numerical) form.
To show values from the XY graph window in the table:
- Right-clicking on the required flow in the table located in the bottom part of the XY graph window.
- The following menu is to be opened.
- Choose Display table ... from the menu.
- The table containing values of given graphic flow is to be opened.
You can sort the values downwardly or upwardly by clicking on the header of
column in table.
Clicking on header of column Nr. sorts the values according to arrival of the values into table.
Clicking on header Value X / Value Y sorts the values according to X value / Y value.
Related pages:


Pridať komentár