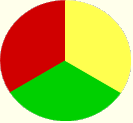
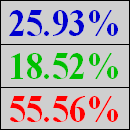
Proportional display expresses the contribution of a value to a total. Total is created by the sum of values of all objects displayed in the diagram. There are 5 display types available":
- Pie diagram
- Horizontal displayer
- Vertical displayer
- Horizontal percentage displayer
- Vertical percentage displayer
Examples of proportional of a proportional display displayed in process the D2000 HI process:
| Pie diagram | Horizontal displayer | Vertical displayer | Horizontal percentage displayer | Vertical percentage displayer |
Create pie diagram
- In the Drawing toolbar, click the Pie diagram .
- Point the mouse cursor to the position of the first diagram corner and click.
- Point the mouse cursor to the position of the diametric diagram corner and click.
...
Each displayer of the Pie diagram type can display the values of as many as 12 objects. So the tab Objects contains input edit boxes allowing to define 12 objects. To define the objects to display in the displayer either enter its names or select them from a list opened by clicking the button placed right from the input box.
Color for displaying the given object is defined by clicking the button placed left from the input box.
For the object of Structured variable type, you must define the column name (the parameter Column) and the row number (the parameter Row). For the object of Value arraytype,you must define a an item (the button L) , whose value will be displayed.
...
| Pie diagram | Each value is represented by a sector , whose size corresponds to the total value. | |
| Horizontal displayers | Each value is represented by a bar , whose weight corresponds to a the total value. | |
| Vertical displayer | Each value is represented by a bar , whose height corresponds to a the total value. | |
| Horizontal percentage displayer | Each value is represented by a percentage placed in the corresponding section of the displayer. | |
| Vertical percentage displayer | Each value is represented by a percentage placed in the corresponding section of the displayer. |
Appearance
| Diagram A diagram is drawn with the a frame and background. | |
| Diagram A diagram is drawn with the a double frame and background. | |
| 3D effect - sunken diagram. | |
| 3D effect - raised diagram. | |
| Diagram A diagram is drawn with a 3D frame. |
Frame and Fill
The parameters Frame and Fill allows allow to define colors for the parts (frame and fill) of the proportional display. Color is defined by selecting from the color palette opened by clicking the the color sample of correspondent the corresponding parameter. The frame can be switch switched on/off as necessary for the Pie diagram.
Number of decimal places
Number The number of decimal places for percentages is displayed in the displayer.
...
Specifies the name of the displayer in the form of a reference variable for use in the picture script.
...
Assignment of application data (metadata) to a graphic object. If the object contains some metadata, the name of the first record will be displayed in the button. Multiple records are indicated by ",...".
Event
The listbox list box allows a user to select the active picture event for the displayer. The listbox list box contains the following active picture events:
...
Text to display as a tooltip when the user points the mouse cursor to the displayer in the picture opened in process the D2000 HI process.
Possibility to use the Dictionary (to open press CTRL+L).
URL
Definition of the URL address to open a web page from a picture. The address may be set also in the picture script by the function %HI_SetOBJURL.
Requirements
| Minimum supported version | D2000 V12.1N |
| Info | ||
|---|---|---|
| ||
...


