...
The status bar of process D2000 HI contains the information on the current time and date placed on the right side. There are the bulb icon and three icons on the left side. In case that an alarm situation is occurred in the system - e.g. at least one object of alarm type is in alarm status - the bulb icon starts blinking to indicate the occurred situation. Clicking this icon opens the dialog box showing all defined or current alarms in the system.
Warning: the bulb icon is not displayed if user doesn't have the rights to view alarms. For more information about alarms in D2000 system, see the topic Controlling exceptions in logged process.

| 1 | Bulb icon - alarm situation indicator. |
| 2 | Opens the list of all |
| minimized information windows (pictures, graphs |
| , ...) | |
| 3 | Opens the list of all |
| information windows (pictures, graphs |
| , ...) | |
| 4 | Indicators showing the connection status in the redundant system + redundant group name. |
| 5 | Current system time - HOUR:MIN:SEC. |
| 6 | Current system date - DAY.MONTH.YEAR. |
Clicking the  the
the ![]() icon opens the list of all graphic information windows (pictures, graphs and reports), opened on HI desktop. .
icon opens the list of all graphic information windows (pictures, graphs and reports), opened on HI desktop. .
 resp
resp 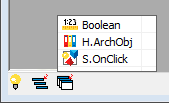 in newer version
Choosing a graphic information window from the displayed list sets this window as active one and places it over all other opened windows.
Clicking the  the
the ![]() icon opens the list of all graphic information windows (pictures, graphs and reports) minimized on HI desktop.
icon opens the list of all graphic information windows (pictures, graphs and reports) minimized on HI desktop.

Choosing a graphic information window from the displayed list restores down this window - opens it on HI desktop.
...
If process D2000 HI operates in the redundant mode, the status line contains one or two indicators (according to the number of network lines), that show the status of the connection through individual lines with the active server. The status is indicated by a color and a text, that is displayed when you point the mouse cursor to the indicators. Meaning of colors used for displaying the connection status for redundant systems is shown in the following table:
| Color | Status | Meaning |
|---|---|---|
 - grey - grey | Server not connected (unknown) | Server not connected. |
 - red - red | Line failure Error | If the line used for connection is failed. Unsuccessful connection. |
 / /  - - dark-blue / dark-green | Connecting server | Connecting a server (data reading, BMP synchronization). |
 - blue - blue | Connected to server | Connected to server, no user logged on. |
| - dark-green | User's logon | User's logon. |
 - green - green | User logged on | User logged on. |
| Info | ||
|---|---|---|
| ||
...