Time interval for displaying data in graph
The following dialog box allows to define a time interval for displaying data in the graph.
To define a time interval
- In the graph window, click the button
 –
New time interval.
–
New time interval. - It opens the dialog box allowing to define a time interval.
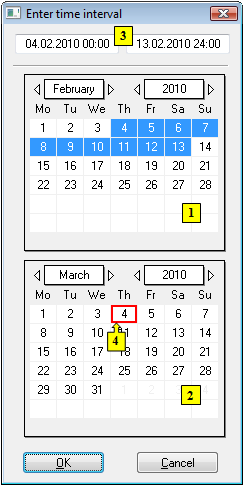
- In the calendar (1), select the required month and year of the time interval beginning (click the items showing year and month). The red item (4) shows the current date.
- In the calendar (2) select the required month and year of the time interval end.
- In the calendar (1) click a day - the time interval beginning and hold down the mouse button.
- In the calendar (2) click a day - the time interval end and release the mouse button.
- Time interval may be also defined in the input fields (3) showing required time parameters (3).
- To confirm your settings click the OK button.
Note:
Time interval within one month can be defined in one of the calendars.
0 komentárov