Structured variables (structures) serve to simplify work with repeated technological units - PLC, technological lines, generators, etc.
Tip
To familiarize yourself with working with structured variables and their displaying, the following webinar recordings available on YouTube are also useful:
Basics
A structured variable is something like a table in Excel - it has rows and columns that contain values. Rows are referenced by numbers in square brackets after the structure name (e.g. SV.Test[1] or SV.Test[2]), and columns have their own names (e.g. ColumnA, ColumnB, Temperature1). Individual items are accessed by specifying the row number and column name, e.g. SV.Test[2]^ColumnA or SV.Test[1]^Temperature1.
Column names as well as value types in individual columns and other properties are defined in the Structure Definition. When creating a structured variable, it is necessary to specify what its structure definition is - and of course the number of rows.
Individual columns of the structured variable have a specific value type defined, which can be Logical, Integer, Real, Absolute time, Relative time, Text, and Object (other D2000 objects are connected to such a column - e.g. I/O tags).
Each technological unit is represented by one row of a structured variable.
The D2000 supports the creation of:
- structured eval tags - one calculation for all lines of the structure
- structured historical values
- primary - archiving of the entire column of the structured variable
- calculated - one calculation of the expression for all rows of the structure
- statistical - one calculation of statistics for all rows of the structure
- filled from the script
- instance pictures (schemes) - the instance picture displays values from the N-th row of the structured variable. The instant picture can be inserted multiple times into the standard picture and thus repeatedly display data from specific rows
- instance graphs - similarly to an instance picture, a graph can also display values from the N-h row of a structured variable. Instance graphs can be opened from both instance and standard pictures.
Example
Let's have several PLCs, each of which has a name and three temperatures T1, T2, and T3, which are obtained from communication. We want to calculate the average of these temperatures and also display the communication status. We want to calculate a 5-minute weighted average from the average temperature (using the archive).
First, we create a structure definition. The Name column will be text, the communication columns will be Object type, and the averages will be real numbers.

Subsequently, we will create a structured variable with the structure type SD.MyPlc. It can have any number of rows. In the first three rows, we will connect objects from communication - I/O tags with temperatures and statuses of individual stations.

Tip
If we want the structured variable not to be constant (so that individual items can be written), we check the Manual option. If we want to set the writing option only for individual columns or items, we can redefine Manual at the column level (in the header) or down to individual items. The same applies to other properties configured for individual columns in the structure definition (limits, saving of the start value, hysteresis, text palette, index to transformation palette).
Structured eval tag
If we want to calculate the average temperature for all rows and write it in the TAvg column, it is enough to create one structured eval tag. Enter the Value Type "Ae - Analog" and enter the arithmetic average as the expression
( SV.MyPlc[0]^T1 + SV.MyPlc[0]^T2 + SV.MyPlc[0]^T3) / 3
By specifying row [0] we define that we are working with all rows. We want to store the result in the TAvg column, so we set the Destination column to SV.MyPlc[0]^TAvg.

In fact, such an eval tag definition causes the D2000 Calc process, which is the parent of the eval tags, to create one "shadow" eval tag for each row of the destination structure and generate the corresponding calculation for it:
- 1. row: ( SV.MyPlc[1]^T1 + SV.MyPlc[1]^T2 + SV.MyPlc[1]^T3) / 3
- 2. row: ( SV.MyPlc[2]^T1 + SV.MyPlc[2]^T2 + SV.MyPlc[2]^T3) / 3
- 3. row: ( SV.MyPlc[3]^T1 + SV.MyPlc[3]^T2 + SV.MyPlc[3]^T3) / 3
- ... etc.
The advantage of structured eval tags is that we define the calculation for all rows of the structure in a simple way. In addition, if we add more rows to the structure, new "shadow" eval tags for the new rows will automatically be created, so we do not have to modify the eval tag at all. And if we need to change some parameter of the calculation (e.g. add a new temperature T4), it is convenient to do it in one place.
Such a structured eval tag only publishes values to a structured variable, it itself has no value.
Tip
We recommend naming the structured eval tag so that it contains the name of the structured variable and the name of the target column - in our case P.MyPlc.TAvg - then it will be easier to search using referential integrity.
Should any of the temperatures be invalid (e.g. due to a communication failure), their sum will also be invalid. This can be solved either by setting "Replace Invalid values with 0" or, if a different replacement is needed, with the %IsNull function. For example, the following expression replaces invalid values in column T1 with a temperature of 20, T2 with a temperature of 25, and T3 with a temperature of 30 degrees:
(%IsNull(SV.MyPlc[0]^T1, 20) + %IsNull(SV.MyPlc[0]^T2, 25) + %IsNull(SV.MyPlc[0]^T3, 30)) / 3
Advanced tips
Various mathematical functions and expressions can be used in eval tags, including a conditional expression.
The so-called extended syntax is also supported, which allows dividing the calculation into several steps, defining local variables, using the condition IF - THEN - ELSE and jumping to the label - GOTO.
Structured historical values
If we want to calculate a weighted average in the archive, we must first archive individual columns with temperatures in the primary archive, then create a calculated archive (average of primary archives - similar to a structured eval tag), and finally a 5-minute weighted average.
Primary structured historical values (archives)
We will create primary archived values for each of the columns T1, T2, and T3.
Tip
When we have a structured variable selected in D2000 Cnf and we click the "Insert to a list of archives" icon, we can select the columns we want to archive. We do not recommend archiving the entire structure as a whole.
If we create historical values by clicking on the "New object" icon in the toolbar, it is advisable to create their names from the name of the structured variable and the name of the archived column.
Similar to the structured eval tag, we specify the archiving of the entire column (SV.MyPlc[0]^T1, SV.MyPlc[0]^T2, and SV.MyPlc[0]^T3).

In fact, such a definition of historical value will cause the D2000 Archiv process, which is the parent of the historical values, to create for each row of the archived structure one "shadow" historical value that will archive the corresponding row (1, 2, etc.).
The advantage of structured historical values is that we define archiving for the entire column of the structure in a simple way. In addition, if we add more rows to the structure, new "shadow" historical values will automatically be created for the new rows, so we don't have to modify the historical value at all. And if we need to change some archiving parameter (e.g. history depth), it is convenient to do it in one place.
Calculated structured historical value
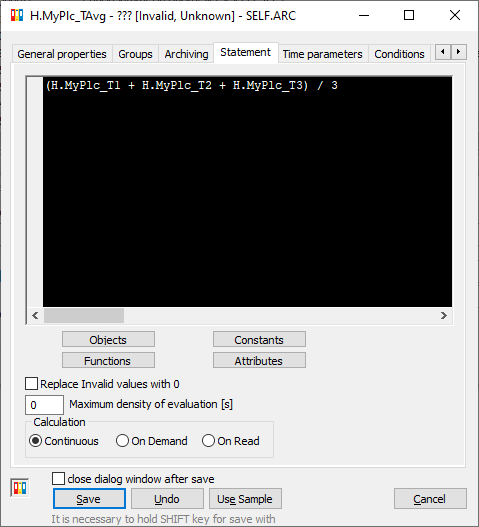
The next step is to create a calculated structured historical value that will calculate the average of temperatures. We will create a historical value named H.MyPlc_TAvg, set the Archive purpose to Calculate archived values by defined statement.
We will set the Archive size to any of the three source archives, e.g. H.MyPlc_T1 (it is also possible to use a structured variable item for the dimension, e.g. SV.MyPlc[0]^TAvg, in this case it would also be possible to check Publish values and the calculated averages would be published in the specified column (so we would not even need the above created structured eval tag P.MyPlc.TAvg).
On the Statement tab, we enter the arithmetic average of the source archives. It is possible to use syntax
(H.MyPlc_T1 + H.MyPlc_T2 + H.MyPlc_T3) / 3
or with the specification of zero-row indices (to make it clear that this is a structured calculation):
(H.MyPlc_T1[0] + H.MyPlc_T2[0] + H.MyPlc_T3[0]) / 3

In the statement, other historical values and constants may appear, but not types of D2000 objects (e.g. I/O tags). If we want to use the values of another type of object, we must first configure the primary historical value for it.
In fact, such a definition of the calculated historical value will cause the D2000 Archiv process, which is the parent of the historical values, to create for each row of the archived structure (according to the Archive Size parameter) one "shadow" historical value and generate the corresponding calculation for it:
- 1. row: (H.MyPlc_T1[1] + H.MyPlc_T2[1] + H.MyPlc_T3[1]) / 3
- 2. row: (H.MyPlc_T1[2] + H.MyPlc_T2[2] + H.MyPlc_T3[2]) / 3
- 3. row: (H.MyPlc_T1[3] + H.MyPlc_T2[3] + H.MyPlc_T3[3]) / 3
- ... etc.
The advantage of structured calculated historical values is that we define the calculation for the entire column of the structure in a simple way. In addition, if we add more rows to the structure, new "shadow" historical values will automatically be created for the new rows, so we don't have to modify the historical value at all. And if we need to change some archiving parameter (e.g. history depth) or change some calculation parameter (e.g. add a new temperature T4), it is convenient to do it in one place.
Advanced tips
As with the eval tags, it is possible to replace invalid values with zero, use the %IsNull function, and use various mathematical functions and expressions, including a conditional expression.
The so-called extended syntax is also supported, which allows dividing the calculation into several steps, defining local variables, using the condition IF - THEN - ELSE and jumping to the label - GOTO.
In addition, special functions for calculated historical values are available. It is also possible to use the @EvalTime system constant in the calculation, which represents the time for which the calculation is performed.
Statistical structured historical value
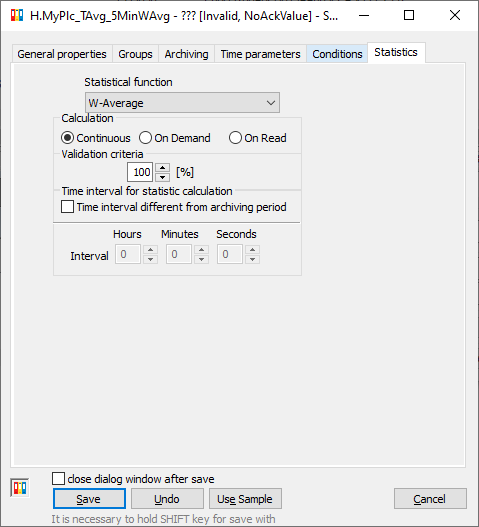
And finally, we will create a statistical historical value H.MyPlc_TAvg_5MinWAvg, for which we will set the Archive purpose to Calculate archived values by statistical function. We set the source Historical value to the calculated historical value with average temperature H.MyPlc_TAvg.
Since we want to publish the result to a structured variable, we check Publish values and set the Target object to SV.MyPlc[0]^TAvg5Min.
On the Time parameters tab, we set the Archiving period to 5 minutes (we create a 5-minute average) and on the Statistics tab, we select the statistical function W-Average.


Advanced tips
D2000 Archiv also allows the calculation of a floating average, if a different time interval for the source data is set on the Statistics tab - e.g. if set to 10 minutes, a weighted average of the last 10 minutes' data will be calculated every 5 minutes.
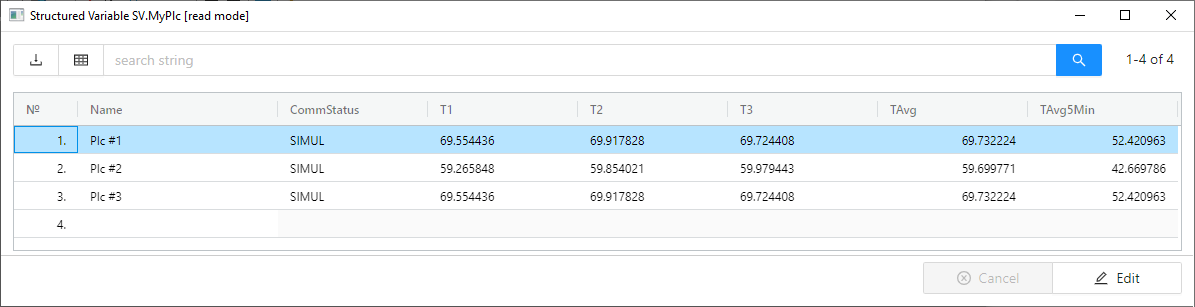
In the D2000 HI user interface, it is possible to view the structured variable and watch how the individual items of the structure change:
Pridať komentár