The user window for alarm management allows you to obtain information about alarms in the system - about their current status (active, acknowledged, blocked), historical course, and details. In the window, it is possible to acknowledge, block and unblock individual alarms.
This chapter describes the window with the new alarm management user interfaces functional from version D2000 12.2.
Opening a Window and its Panels
Opening the alarm management window in the D2000 HI process can be done:
- by selecting Alarms from the Open menu
- by clicking the
 button in the Main toolbar button in the
 - by pressing the F2 button
- or by clicking on the light bulb symbol located in the lower-left corner of the D2000 HI process window
The user window for alarm management can be opened automatically when an alarm occurs if the user or console settings are configured correctly.

This is the default setting of the alarm management window. The default screen settings may be preconfigured in different ways.
The alarm dialog consists of named panels: Active Alarms, Blocked Alarms, All Alarms, and History organized by tabs with their names. We can display the hidden panel by clicking on the tab with its name. Panels can be freely moved around the screen by holding down the mouse button after clicking on its tab. In this way, the alarm screen can be freely organized.
The individual panels display the following data:
- the Active Alarms panel displays the current list of active alarms or alarms that need to be acknowledged (they are in the Acknowledged state)
- the Blocked Alarms panel displays the current list of blocked, temporarily suspended and muted alarms
- the All Alarms panel displays all alarms that are configured in the system
- the History panel shows the current progress of alarm events. In principle, the content of this panel is identical to a specially configured log dialog with data read from the log database
The layout of the panels as well as their configuration is not automatically remembered after a change by the user and switching off the D2000 HI. The default configuration of the alarm window can be set by the user or administrator according to the procedure described in the last subchapter.
All panels contain a table, general functionalities of the table are described in a separate chapter General control of the table in the new user interface.
All alarm panels share a lot of common functionality, whether it's a hideable filter on the left side of the panel, an alarm/event detail on the right, or control of the table and its context panel located above the table. For this reason, the following subchapters are organized to describe the common functionality in one place and thus not repeat the same description unnecessarily several times.
"Active alarms" panel
The panel of active alarms displays all currently active alarms in the system (light red text), in a special case also alarms that are already inactive but require confirmation (so-called mandatory acknowledged alarms). In the table, such alarms are displayed in blue text. An acknowledged alarm that is still active is displayed in dark red. Active alarms can be acknowledged either by double-clicking on a row in the table or by clicking the "Confirm" button at the bottom of the active alarms panel. This button is active if at least one selected alarm can be acknowledged. Next to the acknowledge button, there are also the "Block", "Pause" and "Mute" buttons. "Block" and "Pause" change the status of the selected alarms to blocked. These alarms will be moved from the active alarms panel to the blocked alarms panel. Button "Mute" will also move the alarm to the blocked alarms panel, but only for the currently logged in user. This action will not affect other users and they will see the alarm in its original state.
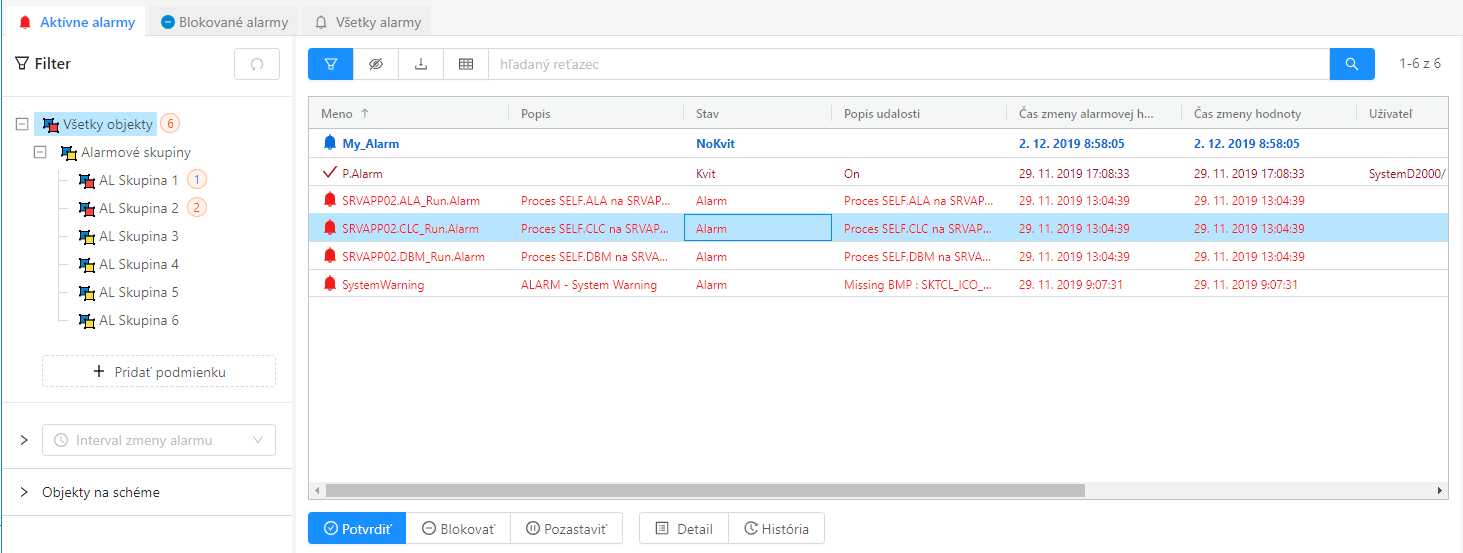 In the active alarms panel, the first alarm in the table is inactive but still requires confirmation, the second is acknowledged but still active, and the remaining alarms are actively unacknowledged.
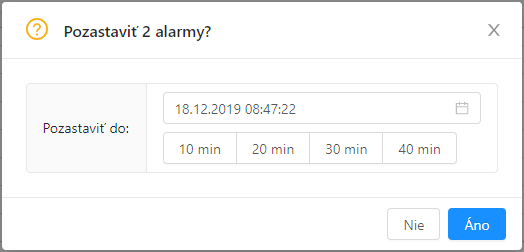
The dialog is triggered by the "Pause" button to pause selected alarms until a certain time. Below the time selector are buttons for quickly setting the lock time to 10, 20, 30, and 40 minutes.
In addition to the status and alarm buttons, the "Detail" and "History" buttons are present at the bottom of all alarm panels. The "Detail" button opens in the right part detail of the selected alarm with the possibility to display all schemes on which the object belonging to the alarm is used. The "History" button displays a separate monitoring dialog with a preset filter for the object selected in the table.
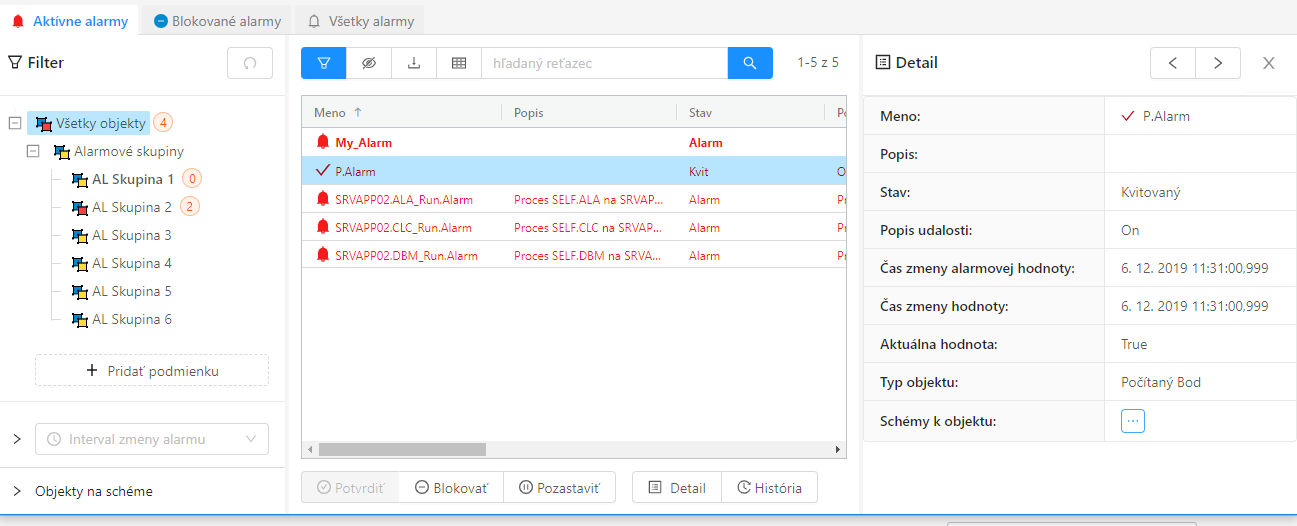 After pressing the "Detail" button, the detail of the selected alarm will be displayed on the right part of the screen.
After clicking the ![]() button next to the Object schemas item, the list of schemas on which the given object (in this case P.Alarm) is located will be displayed.
button next to the Object schemas item, the list of schemas on which the given object (in this case P.Alarm) is located will be displayed.
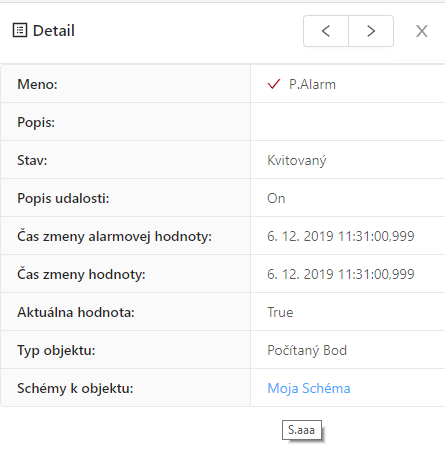
The alarm detail for the P.Alarm object is located on the diagram with the description "My Scheme", after moving the cursor over the line, the name of the scheme will be displayed (in this case "S.aaa").
Via the line with the description or the name of the scheme (if the description is not filled in) it is possible to open the given scheme in the HI window by clicking.
Columns in Alarm Tables
The following columns can be displayed in the alarm list tables:
| Name | The name of the Alarm object or object to which the process alarm applies. |
| Description | A textual description of the Alarm object or object to which the process alarm associates. |
| State | Indication of the state in which there is an object of the Alarm type or the object to which the process alarm relates - the current state of the alarm object. |
| Event description | Description of the alarm event according to the definition assigned when configuring the object in the D2000 CNF process (display mask). |
| Alarm value change time | Time of value change of the Alarm object. |
| Value change time | Time of value change of the object to which the process alarm associates. |
| User | The name of the user who performed the last operation with the alarm. |
| Current value | The current value of the object. |
| Object type | Object type. |
| Technical units | Technical units of the object. |
| Object Id | Internal id of the object associated with the alarm (initially this column is hidden). |
| (description or name of the attribute logical group) | Each attribute logical group is displayed as a separate column. |
Clicking on a column header will sort the items in the list in ascending/descending order according to the key specified by that column.
Alarm Panel Filter
On the left part of the alarm panels, there is a filter that can be hidden by a ![]() button located above the table. The contents of the alarm table change automatically after each change of the filter by the user. The search button located above the table in this case only fulfils the function. After the change, the
button located above the table. The contents of the alarm table change automatically after each change of the filter by the user. The search button located above the table in this case only fulfils the function. After the change, the ![]() button for cancelling all filter conditions (or returning them to the default state) will be available. The filter at the top contains a tree of alarm logic groups. This tree also shows the number of alarms that were not acknowledged (active and inactive) after the name of the given alarm group with at least one unacknowledged alarm. After moving the cursor over this number, more detailed statistics will be displayed with unacknowledged but also acknowledged alarms of the given logical group of alarms. After clicking on an item in the tree, only alarms that belong to the given group are automatically filtered in the table. Multiple alarm groups can be selected at once via the Ctrl key. The alarm group tree can be expanded via the
button for cancelling all filter conditions (or returning them to the default state) will be available. The filter at the top contains a tree of alarm logic groups. This tree also shows the number of alarms that were not acknowledged (active and inactive) after the name of the given alarm group with at least one unacknowledged alarm. After moving the cursor over this number, more detailed statistics will be displayed with unacknowledged but also acknowledged alarms of the given logical group of alarms. After clicking on an item in the tree, only alarms that belong to the given group are automatically filtered in the table. Multiple alarm groups can be selected at once via the Ctrl key. The alarm group tree can be expanded via the ![]() icon at each level. If the alarms selected in the table belong to an alarm group, its name is dynamically highlighted in bold in the tree.
icon at each level. If the alarms selected in the table belong to an alarm group, its name is dynamically highlighted in bold in the tree.
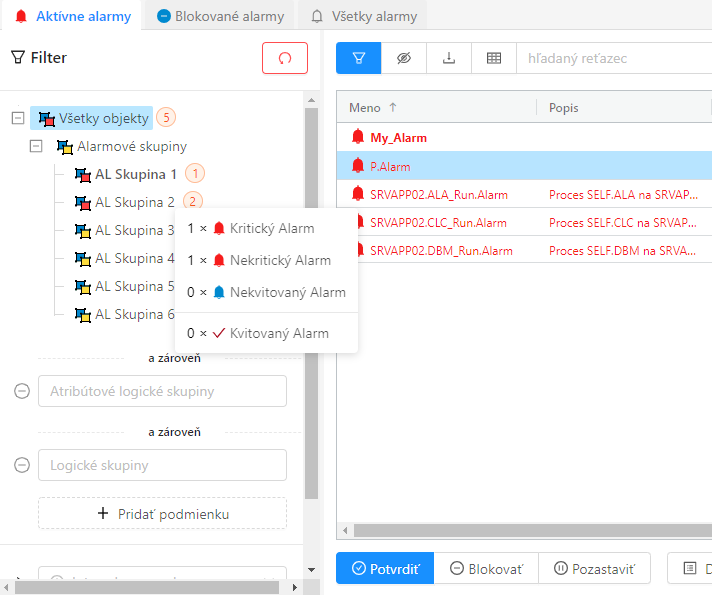
The popup with detailed numbers of active alarms after moving the cursor over the total number of alarms (e.g.![]() ).
).
Logical groups with at least one active alarm also have a changed icon ![]() .
.
If the summary number is displayed with a blue background (e.g.![]() ) it means that there are only unacknowledged inactive alarms in the given logical group
) it means that there are only unacknowledged inactive alarms in the given logical group
The filter of alarm logical groups can be supplemented by filtering of attribute logical groups after pressing the . In this case, a multi-select selector with a list of attribute logical groups is added under the alarm group tree.
 Under the tree of alarm logical groups, after pressing the "Add condition" button, a multi-selector selection of attribute logical groups (icons s) will be displayed.
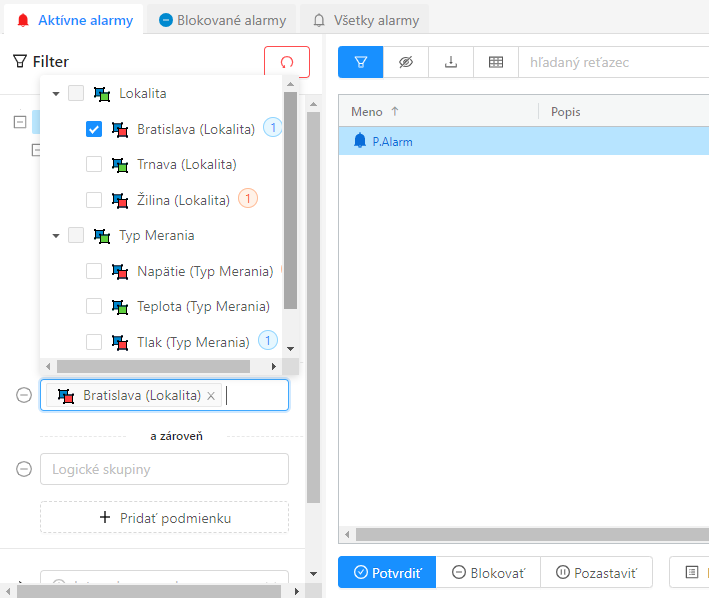
The item Bratislava in the attribute logical group Locality is currently selected in it.
By repeatedly pressing this button, it is possible to add any number of additional logical group filters for the searched objects. Individual multi-select components can be removed in the opposite way by clicking on the corresponding icon - ![]() . Below the
. Below the  button are two more filter components. It is possible to filter out the first alarms that occurred in a given time interval (e.g. in the last 8 hours) through the first one. Through the second, only alarms pertaining to objects on a given schema can be filtered.
.
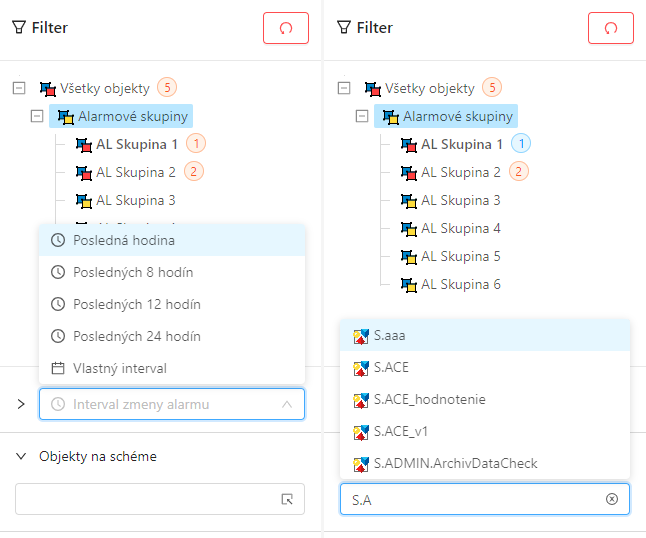 On the left, there is an interval selector for filtering alarms according to the time of their change, on the right, there is a selector of objects of the scheme type with self-completion of the object name (alternatively it is possible to call a separate dialog with schema selection by double-clicking, see the following figure).
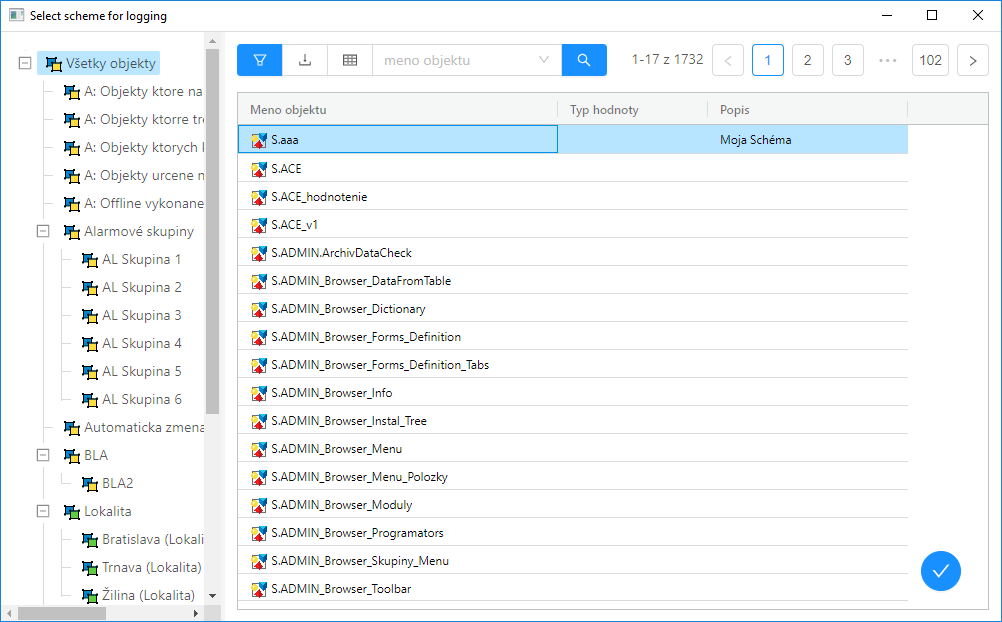
The separate dialog with scheme selection to filter. The scheme is selected either by double-clicking on a row in the table or by confirming with the ![]() confirmation button in the lower right part of the dialog.
confirmation button in the lower right part of the dialog.
"Blocked alarms" Panel
The blocked alarms panel shows the currently blocked or suspended alarms in the system and muted alarms for current user. At first glance, it can be noticed that the buttons at the bottom of the panel have changed compared to active alarms, and it is possible to unblock or unmute selected alarms in bulk in this panel from operations on selected alarms. Alternatively, individual alarms can be quickly unblocked by double-clicking on a table row. In this case, the filter does not display the current numbers of active alarms after the names of the alarm logic groups - these numbers do not make sense in this view.
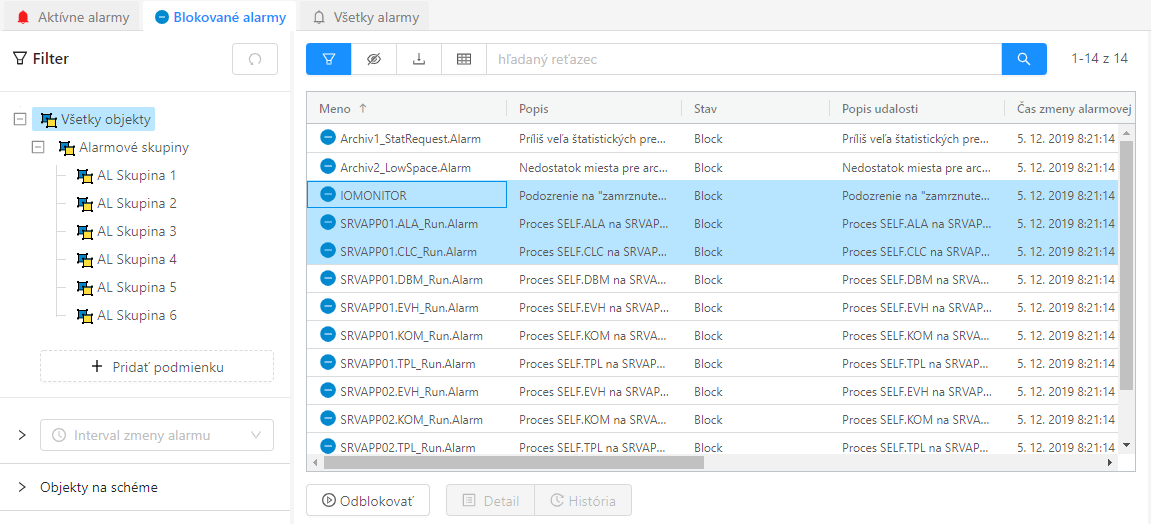
The panel of active alarms, and selected alarms can be unlocked via the button below the table.
"All alarms" Panel
The All Alarms panel displays all defined alarms in the system. This view is important e.g. during regular revisions and checking of defined alarms. Compared to the previous panels, this view contains several changes. Below the table, all buttons for operations with selected alarms known from the previous views are available. The table can contain thousands of records and therefore displays records page by page - paging can be seen in the upper right corner. The content of the filter, which displays all logical groups in the tree instead of exclusively alarm logical groups, has also changed, as in this view it is not strictly bound by minimizing logical group entries for quick identification of alarm situations.
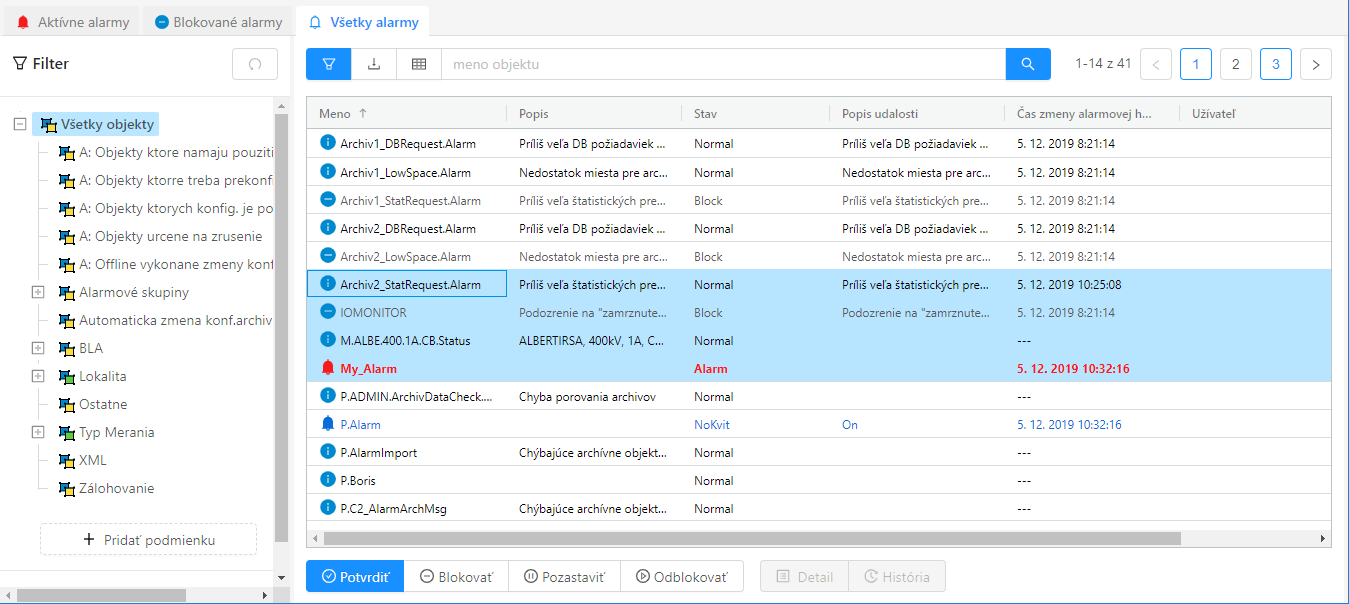
The panel of all alarms, at the bottom of the screen it is possible to notice the buttons with all operations above the selected alarms.
"History" Panel
As the name suggests, this panel shows the historical progress of alarm states. In principle, this is actually the content of the log dialog, which is configured with a preset filter to display only alarm events. This filter can of course be changed. A detailed description of the entire functionality of the log dialog can be found in a separate part of the User Window documentation for displaying data from the log database
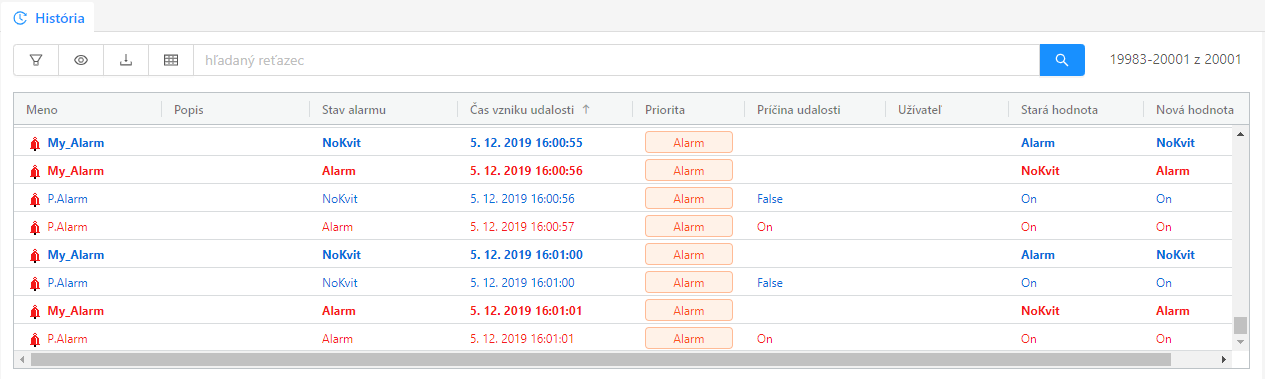 The default state of the view of the historical course of alarms shows the last events that occurred at the end of the table (the table is automatically scrolled down if we do not click on it)
Setting and Saving the Alarm Window Configuration
The alarm window configuration is not automatically saved in the computer's registry as with other windows. Nonetheless, it is possible to explicitly set this configuration for the user, so that this setting is consistent for him on all computers. The current window settings can be saved or exported in the advanced window settings. However, the save button of the window settings window is allowed only to administrators or users who have the configuration allowed to save alarms (checked checkbox "Change alarm window parameters" on the user's mask). The button to export the window configuration to a file is enabled for everyone. Such a file can then be imported into the user settings (item Alarm window configuration). This means that e.g. the administrator can set the same default alarm window configuration for multiple users.
Pridať komentár