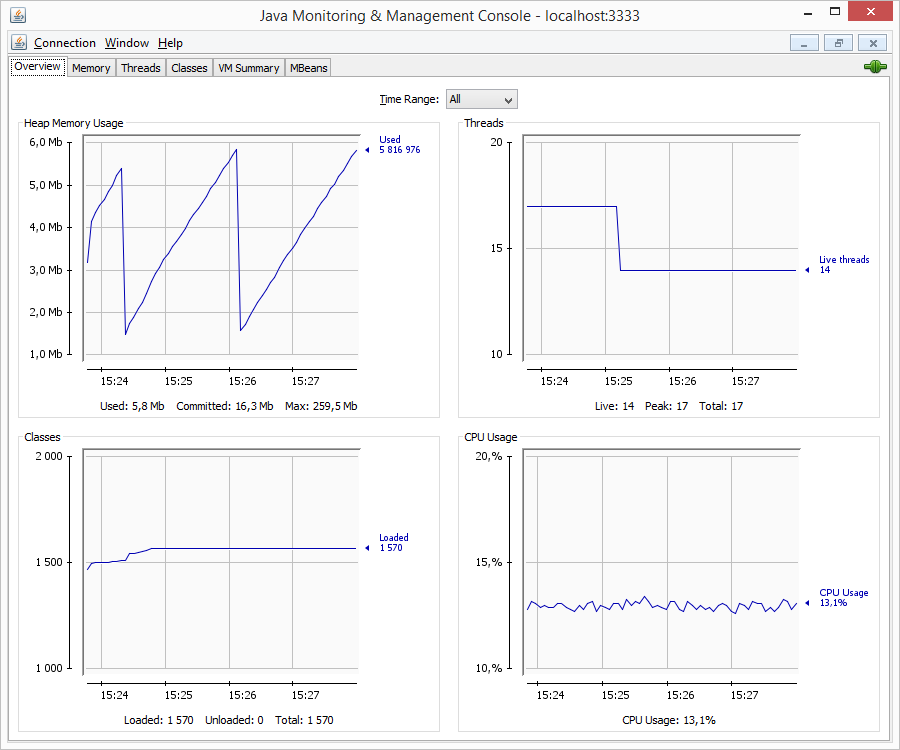
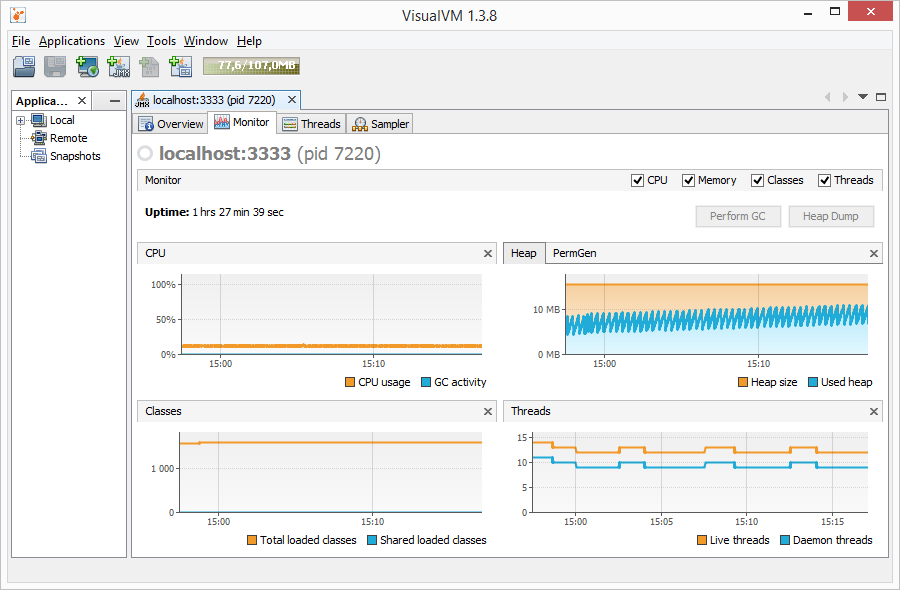
Java Virtual Machine enables monitoring and managing D2000 processes by JMX technology. The monitoring tools connect to JVM through JMX. They enable to monitor the parameters such as size and consumption of memory, CPU load, number of threads and other parameters.
Setting the monitoring process:
To monitor JVM in D2000 process (event.exe, hi.exe, tcts.exe), first this process must run with these parameters:
--jvm-option=-Dcom.sun.management.jmxremote.port=<<port>> --jvm-option=-Dcom.sun.management.jmxremote.ssl=false --jvm-option=-Dcom.sun.management.jmxremote.authenticate=false
where <<port>> represents a unique (in regard to a host) number of TCP/IP port (in the range from 1024 ... 49151), to which the monitoring tool will connect.
Monitoring tools:
jconsole.exe
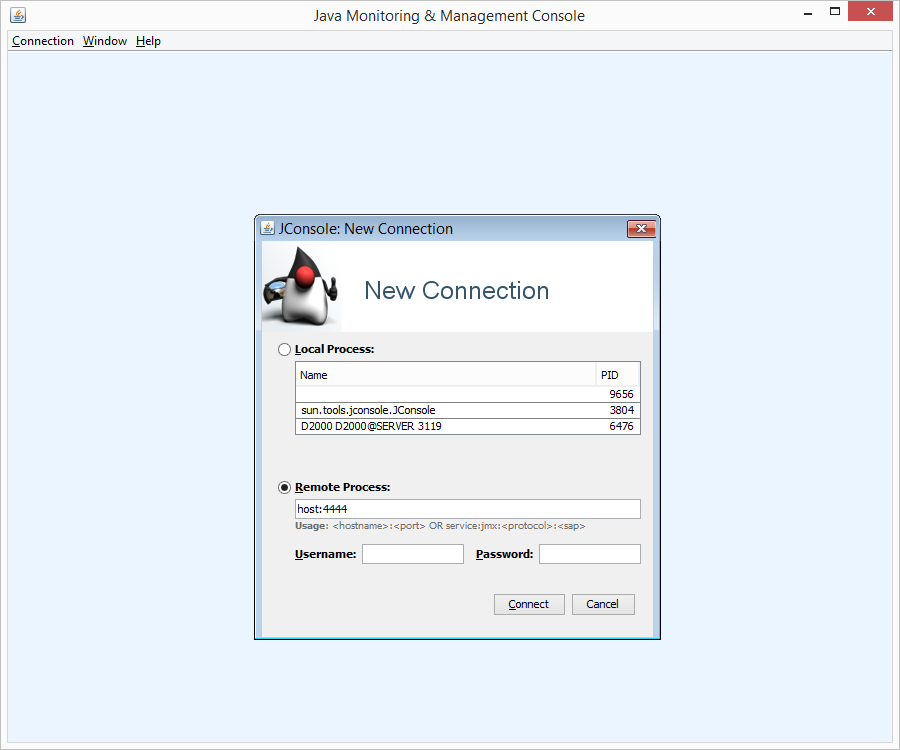
This program is a part of standard JDK installation. After starting, select the option "Remote process", enter the name of workstation, which the process is running on, and port which is set for the process.
Diagnostic information displays after connection:
VisualVM
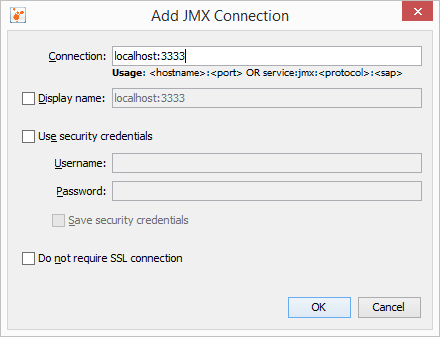
VisualVM is open-source tool (https://visualvm.java.net/). After starting, select "File" -> "Add JMX Connection..." from the menu. Dialog window opens in which you have to enter host:port (similarly as described above in the section for jconsole.exe).
Diagnostic information:


Pridať komentár