

Graph - correction of flows using a mouse
A flow correction (it starts with the help of function %HI_GraphCorrectionStart) allows the user to correct a data curve in the graph using the mouse. The user has to create the correction points (up to 50) that help to define the data correction by the change of their position. The correction points are specified by the marks and linked by the correction curve.
When you left-click over the control point and drag and drop it on the new position, it causes a change. When dragging, the control point, correction curve and data flow are redrawn. The difference against the previous position is shown at the cursor and in the dialog box.
The correction is linear, calculated in the D2000 HI process from the leftmost point to the rightmost one. The final data are stored in the graph and are accessible from the picture script.
To stop the correction, press the Stop button in the dialog window or use the proper function in the script or start correcting the next flow in the graph.

Used definitions:
- Correction point – a definition point of correction which is placed in the graph
- Shifted correction point – a control point of correction, whose distance from the correction point defines the size of the change
- Correction curve – a curve that joins the correction points
- Shifted correction curve - a curve that joins the shifted correction points
The optional parameter of the function %HI_GraphCorrectionStart _multiCorrection function allows 2 modes of working with corrections in the graph
SingleCorrection (_multiCorrection is unspecified or FALSE)
The correction takes place above the specified course and ends by closing the correction window. The table below the graph is not affected by the correction mode.
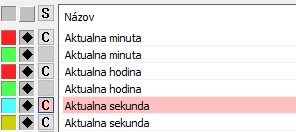
Multi Correction (multiCorrection is TRUE)
In the table below the graph, a set of buttons opens that allow corrections to those in the graph that have been enabled by the% HI_GraphCorrectionLineEnable function. They are marked with the letter "C". The corrected course is highlighted in light red in the table below the graph. Only one waveform can be corrected at a time. It is selected by pressing the appropriate button. After changing the waveform selection, it ends the current correction. Pressing the top button ends the multi-section.
Correction procedure
After starting the correction, the dialog window opens. It contains the list of correction points and the control buttons.
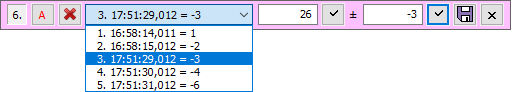
The meaning of the buttons (left to right) is the following:
- Number of flow. It enables to move the window to other position (press the left mouse button, drag and drop it).
- Automatic generation of correction points - generates a set of correction points (max.50) with zero correction size, which can be edited in the correction window.
- Cancels all correction points.
- List of correction points – their position on the x-axis and correction size.
- A new value of the selected point, value can be edited.
- Acknowledges the value of the point 5.
- Correction size of the point. It is editable.
- Acknowledges the value of the point 7.
- Saves the changes. They are stored in the data of graph and are processed by a picture script.
- Ends the correction.
Control in the graph
Add/remove the correction points
When pressing left mouse button together with the CTRL key:
- it enables you to define the control points if you do not press the button over the already defined point. If the defined point is placed close to the data point, this point will move on the position of the data point.
- close to the control point, this point will be used for correction of flow.
When pressing the right-mouse button together with the CTRL key:
- close to the Shifted correction point, it cancels the correction.
- close to the Correction point, it removes it.
Change the position of the correction point
While holding down the CTRL key and the SHIFT key, move the mouse cursor over the correction point or the moved correction point, the cursor for changing the position will appear. Press the left mouse button, move the point and release the button. The movement in the timeline is only possible to the adjacent control point.
Notes:
- Data are corrected if the selected point changes its position.
- Data between the shifted point and adjacent points are corrected.
- Only analog flows, which are placed on the analog axes, can be corrected.
- The correction points can be defined in the level which contains the corrected flow.
- The point reacts on the mouse in the area of the most 5 points from the correction point.
- The correction point can not be defined close to the other one - in regard of the x-axis. You can avoid this feature when using the zoom but some points could be unavailable after you cancel the zoom.
- The correction points that are outside the display field are visible on the edge of the area of the graph and the curve to the closest point is deformed.
- Data correction is visible only if the corrected flow is visible.
- After changing the time interval in the graph, the correction points are canceled.
Related pages:
Pridať komentár