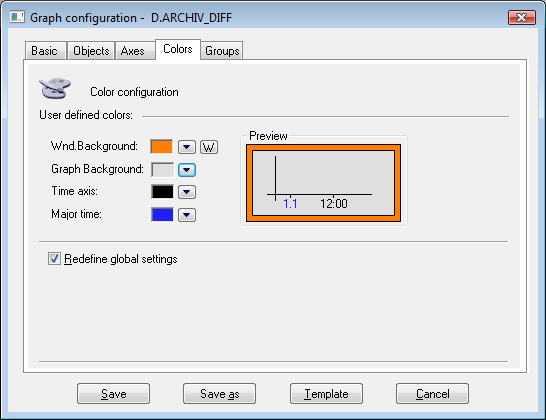
To configure the color appearance of the graph use Colors tab in the graph configuration dialog box.

You can use global color settings for drawing the graph. The second alternative is to define your own color settings for the graph. To define them check Redefine global settings checkbox.
You can set a color of the window background, graph area, time axis and significant time. To select a color of corresponding part use the arrow buttons located right from the currently color example. The color palette is opened after clicking any of these buttons. Each change of a color is displayed in graph preview located right from the buttons.