Viewing Values from the Graph in the Table
Values of objects, that are displayed in a graphic form in the graph window, may be displayed in the table form, too. The table shows a time sequence of values in the text (numerical) form.
To display values from the graph in the table:
- Right-click on the required object in Object column of the table located in the bottom part of the graph window.
- The following menu is opened.
- Choose Display table from the menu.
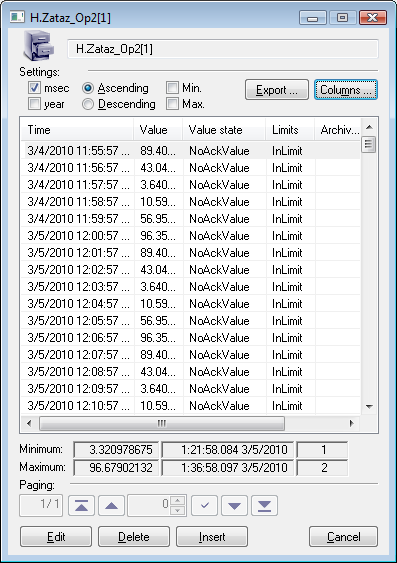
- The table, containing a time sequence of selected object values, will be opened.
The options, accessible in this dialog box, depend on whether displayed data are either historical one or they are changing in time (live data). A table containing live data, from the point of the operator's view, is the same as a table containing the historical values. The options for the operator in case of live data are the subset of the options accessible in case of historical values.
Live data are displayed on a gray background in the table and cannot be edited, unlike the historical data.
A more detailed description of working with the table of values is in the topic Browse historical values. The table described in the topic mentioned above is the same as the table containing historical values.
The displayed table contains the time sequence of values of the specific object. It is an example of a table containing live data.
Related pages:


Pridať komentár