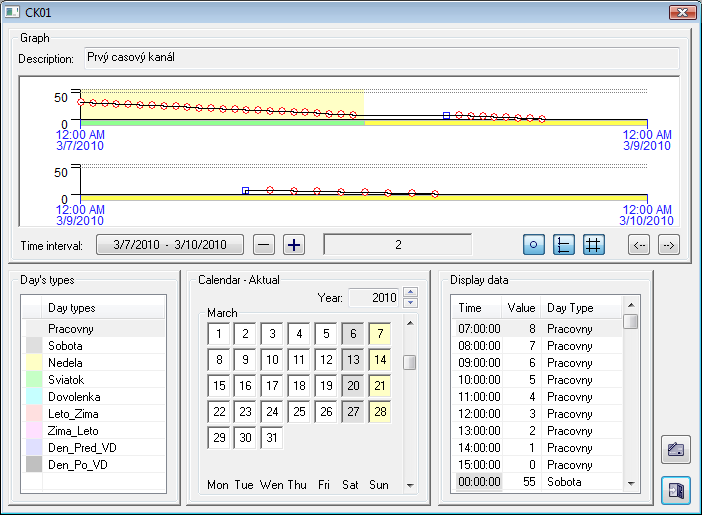
Graphic representation of the time channel data flow
Graphic A graphic representation of time channel data flow shows a data flow of the time channel and corresponding controls. Representation The representation area consists of the time and value axis, background color colour corresponding to the displayed type of day and graphic flow of time channel data applied to the displayed time interval.
The color colour of the mouse cursor hovering over an important point of the graph turns yellow and the point definition (time, value and day type) is displayed. A mouse-click performs selecting this definition in the table of displayed time channel data and the corresponding points are selected in the graph. Displaying of particular parts depends on the user's needs.
 Image Modified
The window consists of the following parts:
- Graphic representation - it displays the graphic data flow of the time channel within given time interval. It allows to define a time interval and to set the drawing parameters. The current value of the time channel is shown in the middle of the bottom part of the "Graphic representation" part.
- Day type - the table of defined day types with a definition of colors colours used in the representation.
- Calendar - it shows configuration data of the displayed calendar.
- Displayed data - the table shows the data definition of the time channel. Selecting the corresponding lines in the table highlights the points corresponding to this selection (a square marks mark will be drawn around these points). This feature can be also used in reverse. Clicking on a point displaying the flow change performs the table selection and all the corresponding points are selected in the graph.
- Edit buttons - the buttons are only displayed in the edit mode (see the topic Edit time channel data).
Control buttons allow the following options:
 Image Modified Image Modified | Allows |
to select | selecting the time interval to show time channel data. |
 Image Modified Image Modified  Image Modified Image Modified | Shrinks / extends the displayed time interval - 1 day to both sides of the time interval. |
 Image Modified Image Modified | Shows definition points in the representation. |
 Image Modified Image Modified | Doubles the drawing flow. |
 Image Modified Image Modified | Shows/hides the grid. |
 Image Modified Image Modified  Image Modified Image Modified | Moves the displayed time interval 1 day backward/forward. |
Dialog box also contains the following buttons:
 Image Modified Image Modified | Allows |
to edit | editing time channel data. |
Button | The button will be displayed only if the user has the access rights to edit the time channel data. |
 Image Modified Image Modified | Closes the dialog box. |
...


