XY Graph displayer allows to display displaying a graphic flow of the values given by coordinates (x, y) from the picture script. The coordinates are defined by means of the function %HI_SetGraphXY_Data.
To create an XY graph displayer
- In the Drawing toolbar, click on the button XY graph .
- Point the mouse cursor to the point of the first displayer corner and click.
- Point the mouse cursor to the point of the diagonal displayer corner and click.
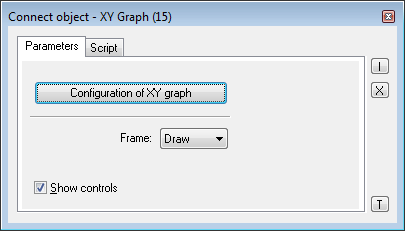
The parameters of the XY graph displayer are being configured in the palette Connect object through the following tabs.
Parameters
...
Configuration of XY graph
Clicking the button opens the XY graph configuration dialog box to set the parameters of the displayer.
Frame
Allows to draw drawing the frame of the displayer. Possible options:
...
Specifies the name of the displayer in the form of a reference variable for use in the picture script.
...
Assignment of application data (metadata) to a graphic object. If the object contains some metadata, the name of the first record will be displayed in on the button. Multiple records are indicated by ",...".
Event
The listbox allows the user to select an active picture event for the displayer. The listbox contains the following active picture events:
...
The button opens the active picture script to define the active picture event specified by the parameter Event.
Note relating to D2000 Thin Client
XY Graph displayer is not implemented in Thin Client.
For more rules see the page Drawing rules and object properties for the D2000 Thin Client.
| Info | ||
|---|---|---|
| ||
...

