...
To open the graph window:
- Select the Graphs item from the Open menu or click
 button in the Main toolbar (or press CTRL+T).
 - It opens the selection window containing a list of graphs.

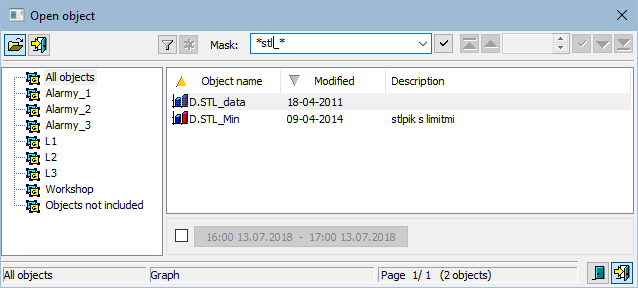
- Select the required graph from the list and click on the button
 or double click on its name. Then a graph initialization (data searching and reading from the system) will start.
If you need to define a new time interval, click the buttonKotva time_interval time_interval  in the opened graph. It opens the following dialog box:
Kotva casovy_usek casovy_usek 
- In the calendar (1), select the required month and year of the time interval beginning (click the items showing year and month). The red item (4) shows the current date.
- In the calendar (2) select the required month and year of the time interval end.
- In the calendar (1) click a day - the time interval beginning and hold down the mouse button.
- In the calendar (2) click a day - the time interval end and release the mouse button.
- Time interval may be also defined in the input fields (3) showing required time parameters (3). (Time interval within one month can be defined in one of the calendars).
To find a particular graph in the list is possible by mask or by filter (clicking on button  ). By using filter, the mask is blocked but the text is not deleted. Push the ENTER key or button
  to start searching.
The text from filter is deleted after clicking on button  . The button is active only if filter contains some text.
After opening the graph...
Range of time axis:
In case that there is not defined a time interval, time axis range is defined by the graph configuration as follows:
- For live data - there is displayed this interval <(Current time aligned by Time shift - Length) ... (Current time aligned by Time shift)>.
- For non-live data - there is displayed this interval <(Current time aligned by Time shift - Length) ... (Current time aligned by Align)>.
Graphic representation of object:
In case that the graph contains object that has been archived, its historical data are will be read after opening the graph. If the object has been archived by several archive object (object of Historical value type), there will be only read the values of one of the archive objects - the one that was created as the first (has the lowest ID).
For dynamic graphs, the behaviour after the graph is opened depends on the configuration of dynamic graphs and the configuration of the object, the dynamic graph is opened for.
...
The buttons placed on the bottom right corner determine the behaviour of the selection window after selecting an object:
 | Unclose the selection window. |
 | Close the selection window. |
Note
- If the notice List is empty! appears in the window it means that no graph, with name matching given mask, has been inserted into the list or logged on user does not have the access right to graphs.
| Info | ||
|---|---|---|
| ||