...
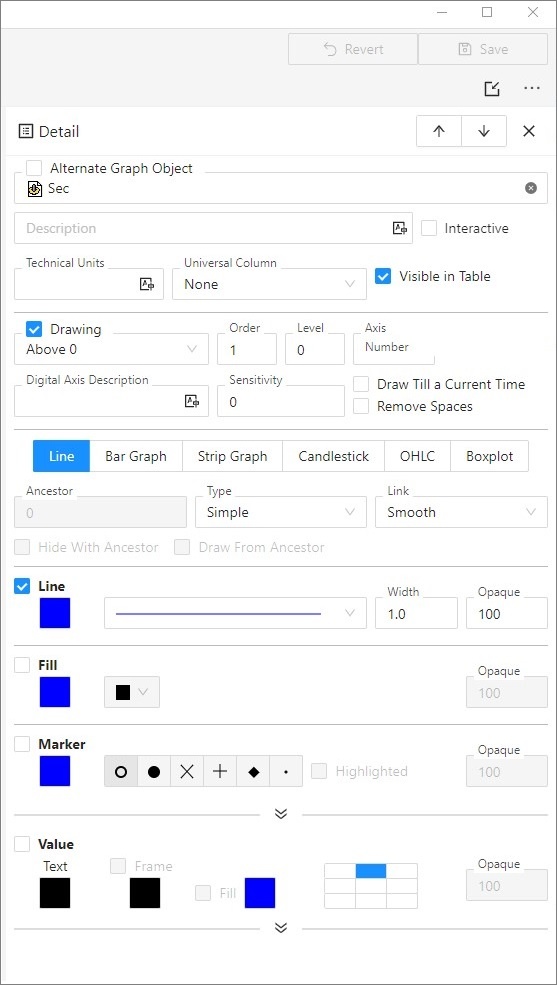
A dialog window is intended for a configuration of objects (flows) in a graph. Every object has its own Detail window to set the parameters. Order of the objects is changed by buttons  .
.
| Kotva | ||||
|---|---|---|---|---|
|
Alternate object is a special default "object". The object reserves a place for the graphic flow, data of which are gained from the script of the picture, where the corresponding graph is placed. Displaying and contents of this object is defined in the picture script. A graph does not contain this object until it is activated from the script. Its label is "*".
...
| Kotva | ||||
|---|---|---|---|---|
|
Technical units of the objects, values of which are to object that will be displayed in the graph. Technical units will be shown in the graph table - the column column Units.
If the parameter is not entered, the graph table will contain the technical units defined in the object configuration* (the parameter Technical units). If there is no technical units defined in the object configuration, the table graph will show no technical units.
* For structured objects - if the structured object is archived, there will be used the technical units defined for respective archive object (object of Historical value type). If is not archived, there will be used the technical units defined in the configuration of the structured object.
...
Note:
If the object is Boolean type, the digital axis has to be assigned to it. Object values will be drawn onto the digital axis for which you must select a level (Digital axis level and description item). Each of defined levels can have a description.
Using the digital axes is described in details in the topic Axis configuration.
| Kotva | ||||
|---|---|---|---|---|
|
...
Causes to leave out the spaces without data in a graph flow.
Row
Definition of a row of defined structured object.
Note: If it concerns about active object, the option Row is disabled.
Column
Definition of a column of defined structured object.
Draw
Selection the parameters for graph drawing. By marking the individual parameters is possible to define the particular parameters of drawing. The options for definition are displayed in the right part of configuration window. Only parameters for line, fill and marker can be defined together.
...
Defines the colour, style (solid line, dotted line, ...), transparency (0-transparent, 100-opaque) and line width in the range of 0,5 - 5,5 multiple of a point width on the screen.
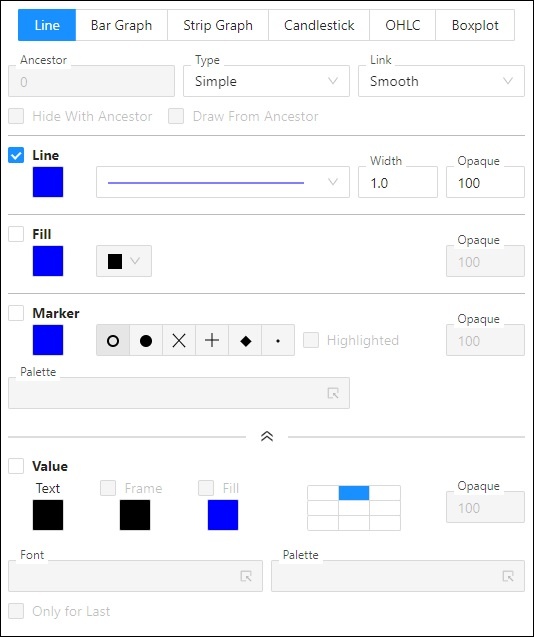
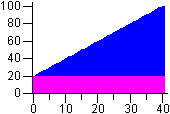
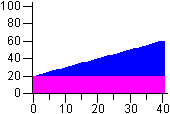
Fill
Fill pattern of the line and transparency (0-transparent, 100-opaque).
...
Defines the parameters for displaying of numerical value in graph.
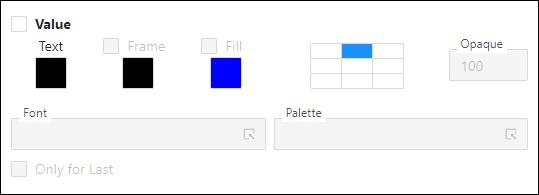
1 - setting of the color transparency, 0-transparent, 100-opaque.
| Text | - | Text | - color of the text |
| Frame | - enable / disable to draw a frame and to define its color | ||
| Fill | - enable / disable the fill and its color and opaque | ||
| Font | - font type | ||
| Position | - position of the text in regard to position of presented value in graph | ||
| Only for last value | - enable / disable to display only the last value or all values |
...
There are several settings that are defined for a graphic flow of Bar graph type and they are distinctive for this graph type.

1 - setting of the color transparency, 0-transparent, 100-opaque.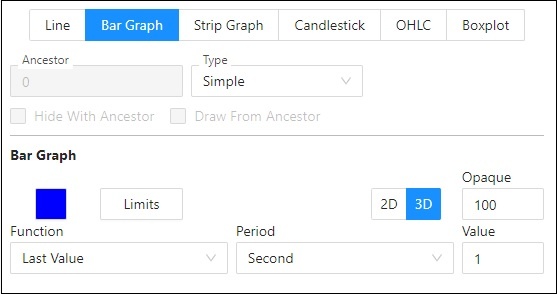
Function
One column of bar graph need not represent just one object value but a whole group of values. Column height is given as a result of a function applied on whole group of values. You can choose from the following functions:
...
Strip graph is suitable to display time flows of alarms, eventually other objects that acquire discrete values. Digital axis have to be assigned to strip graph. There are defined several settings for strip graph, that are other than other types of graphs.

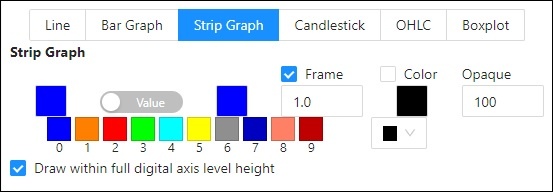
Draw within full digital axis level height
The parameter allows to draw strips of the graphic flows either within full height of the digital axis level or only within one half of the level (older versions of D2000 system).
Value
The dropdown box consists the list of possible values of the object the flow of Frame
Defines the border of the flows, colour and frame width in the range of 0,5 - 5,5 multiple of a point width on the screen.
Value
The dropdown box consists the list of possible values of the object the flow of which will be displayed. Maximum number of values is 10. You must define a mode of displaying of each value by means of Color, Pattern and Opaque (0-transparent, 100-opaque). Selecting empty pattern disables displaying the strip for particular value.
Candlestick / OHLC graph / BoxPlot

Frame
Defines the border of the flows, colour and frame width in the range of 0,5 - 5,5 multiple of a point width on the screen.
Candlestick / OHLC graph / BoxPlot
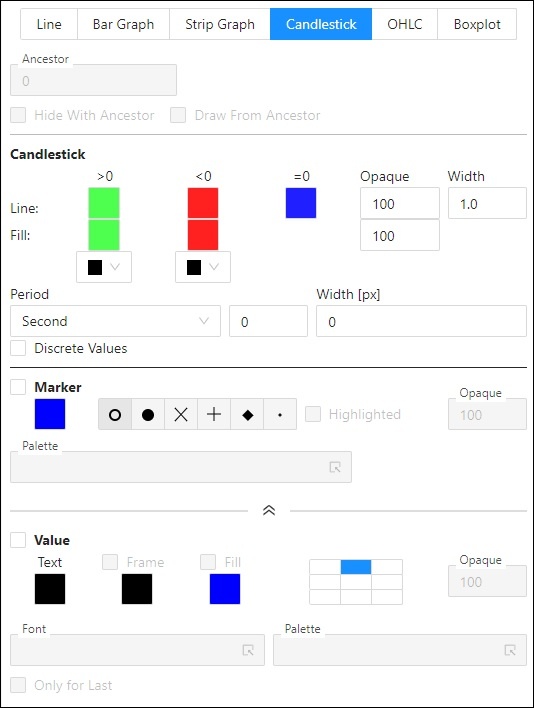
Graph works in two modes:Graph works in two modes:
- Changed - period is 0
If the value changes the column is drawn whereby the color of column depends on positive, none or negative change.
- Statistic - period differs from 0
Within the range, according to set period, it calculates an open, maximum, minimum and close value from input data. These values are represented by column bar that illustrates range of open and close value, and by thin lines that illustrates maximum and minimum of value within the given time period. If the checkbox Discrete values is checked off, the first new valid value from the interval is considered as open value. If the checkbox is not checked off the value valid at the began of open interval is considered as the open value of the interval.
...
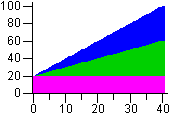 | 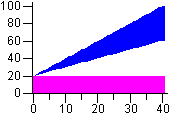 |  |  |
| figure 1 | figure 2 | figure 3 | figure 4 |
...
If a graph containing an active graph object is placed in picture as displayer, the row number of the active object can be controlled from the picture script, too. The row number, in dependence on the displayer configuration, can be also derived from the picture instance number.
Note: Graph containing active object becomes so-called active graph.
...
| Info | ||
|---|---|---|
| ||