...
Basic parameters of the graph are being defined in the Graph configuration dialog box - Parameters tab.

Description
A text string describing the content of the graph. Description along with the name will be displayed in the list of graphs.
Possibility to use the Dictionary (to open press CTRL+L).
Color palette
Selection of color palette that will be used for configuration of the given graph.
Graph type
| Timeseries graph | |||||||
| The parameter allows automatic drawing the flows of the objects, values of which are being changed in time (live data). | ||||||
| XY Graph | If the option is marked, it is XY graph, otherwise it is the time graph. |
...
Enables/disables the description of Y-axis if is defined (the parameter Axis description in the Axis configuration dialog box).
Show
The checkboxes are used to show or hide the particular parts of the graph window after opening. Checked items mean that corresponding parts will be displayed after opening the graph. Descriptive graph table, pointer, grid and common y-axis settings may be enabled/disabled in the graph window by means of corresponding buttons.
Help
The parameter allows to define an application help page to be opened after pressing the key F1 while the graph is active. If the parameter is not defined, there will be opened the standard D2000 help.
Export subdirectory
Setting the export subdirectory that can be done in two ways:
...
| Kotva | ||||
|---|---|---|---|---|
|
View on Open
The button has three states and enables to configure two ways of hiding the table in connection with the size of graph window.
First way enables to hide / show the table after clicking ![]() . It is indicated by grey / yellow color of table icon in the graph. The second one enables to hide the table after the graph window is reduced, which is indicated by dark grey / red color of icon.
. It is indicated by grey / yellow color of table icon in the graph. The second one enables to hide the table after the graph window is reduced, which is indicated by dark grey / red color of icon.
The checkboxes are used to show or hide the particular parts of the graph window after opening. Checked items mean that corresponding parts will be displayed after opening the graph. Descriptive graph table, pointer, grid and common y-axis settings may be enabled / disabled in the graph window by means of corresponding buttons.
...
- Minimum - minimum object value within the time interval defined for the graph
- Auto Minimum - minimum object value within the time interval defined for the graph - the column is visible only when graph displays the non-live data (the parameter Live data is not checked or when user sets the past by button
 New time interval)
 - Maximum - maximum object value within the time interval defined for the graph
- Auto Maximum - maximum object value within the time interval defined for the graph - the column is visible only when graph displays the non-live data (the parameter Live data is not checked or when user sets the past by button New time interval)
- Sum - sum of all valid object values within the time interval defined for the graph
- Weighted Average - weighted average of all valid object values within the time interval defined for the graph
- Arithmetic Average - arithmetic average of all valid object values within the time interval defined for the graph
- Last Value - last object value
- Auto Last Value - last object value - the column is visible only when graph displays the live data (the parameter Live data is checked) and graph changes because of new data are received
- Universal - content of the column is defined by the parameter U.C. in the object configuration or the function %HI_SetGraphLineStat
Note: For graphs containing live data (the parameter Live data is checked), there are evaluated all values within the time interval including last value. Last value of non-periodic data is not evaluated.
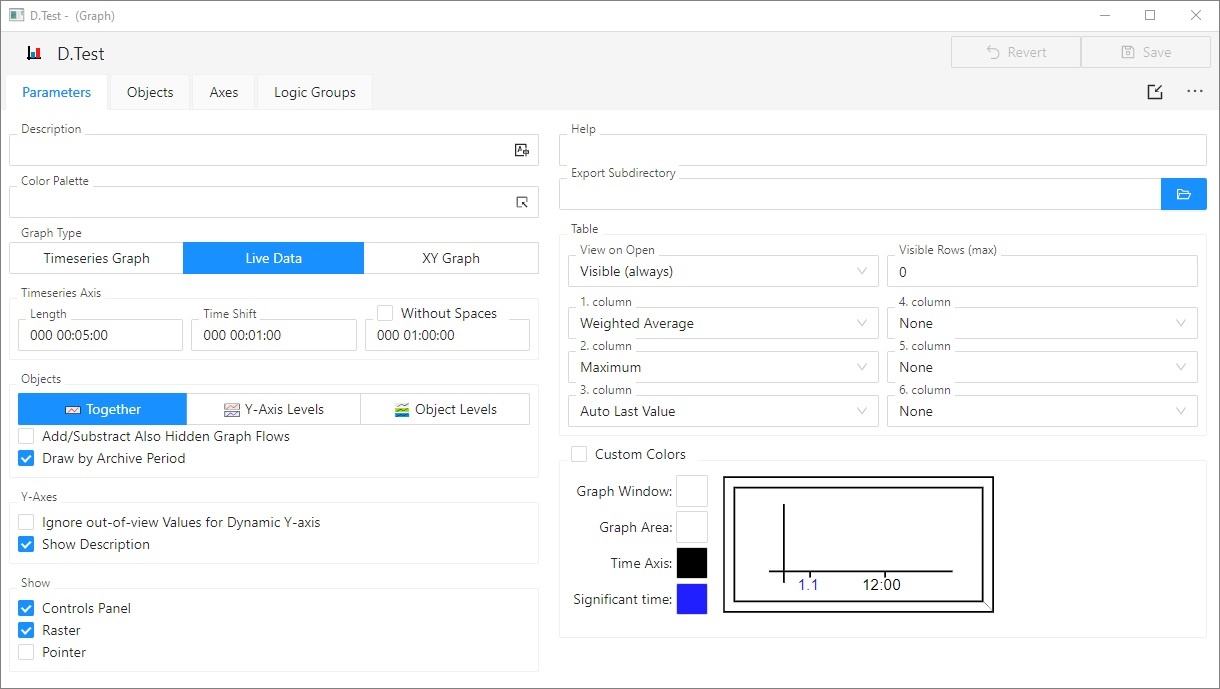
Custom colors
You can use global color settings for drawing the graph. The second alternative is to define your own color settings for the graph. To define them check Custom colors checkbox.
You can set a color of the window background, graph area, time axis and significant time. To select a color of corresponding part use the array of currently set color example. The color palette is opened after clicking at this array. Each change of a color is displayed in graph preview located right from the buttons.
| Info | ||
|---|---|---|
| ||