Description of "Graph configuration" dialog box - Objects
A graph can display the flows of up to 99 object values. The
...
tab Objects in the dialog box is used for configuration of flows.
...
The buttons are accessible when some object is chosen in the list.
While an object is modified (in Object configuration dialog window) most of the buttons are disabled. An edited object can be changed by doubleclick in the list of object or by selecting the object and clicking on Edit button.
...
To configurate the selected object, open the window Detail by double click.
...
If the parameter is checked, all additive (subtractive) graphic flows, which are hidden using the button 2 in the graph window, will be added/subtracted into/from the graph.
Draw by archive period
If checked, the flows of periodical archive data in the graph are to be drawn by the stored time of the data (see the parameter Stored time in the configuration of object of Historical value type).
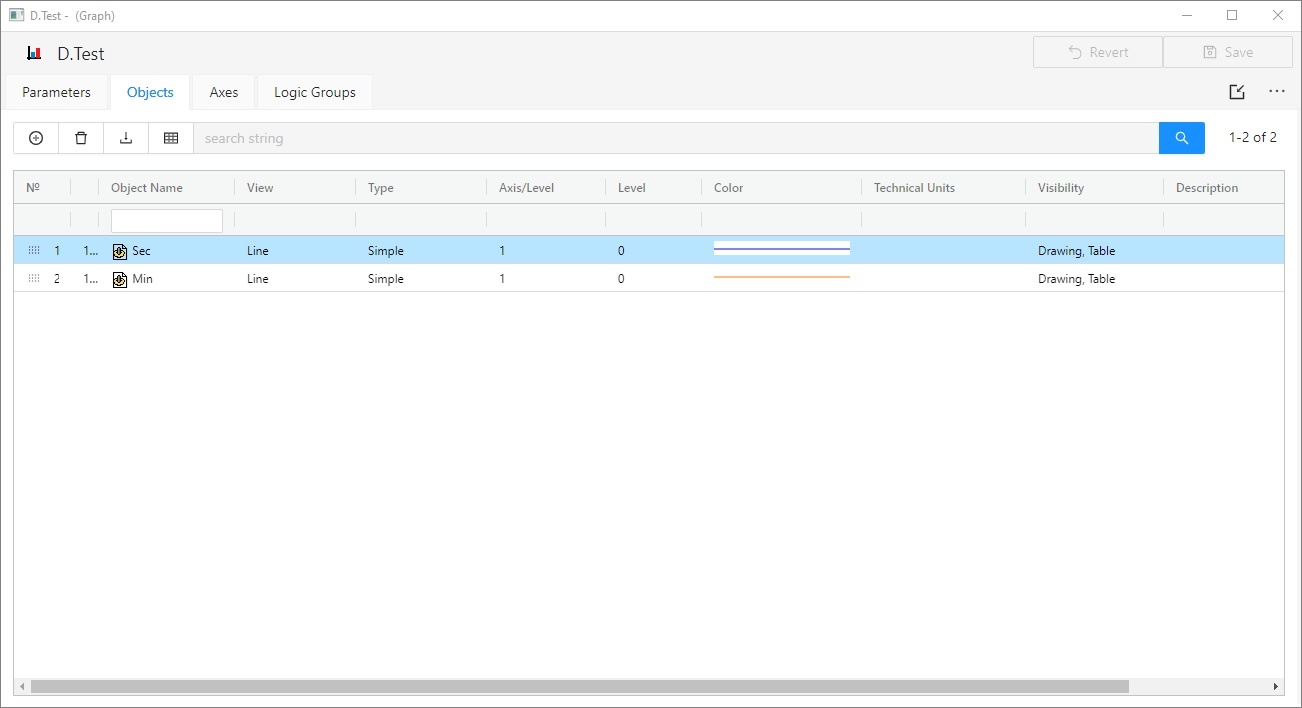
Objects
List of objects to display their flows in the graph. The list consists of the following columns:
| Nr. | Serial number of the object. |
| O. | Order of the object drawing. It is set in the |
| Detail dialog box, in the section Drawing - the parameter Order. |
| Object name |
| To change the object name, type the new name into the Alternate Graph Object row in the Detail dialog box. | |
| Type | Graphic flow type with the drawing mode mark placed before (the parameters Types of graphic flow and Drawing in the |
configuration dialog box Detail). Note: For additive/subtractive types of flows, the column also shows the number of ancestor of the given flow (see the parameter Ancestor in object configuration).
| ||||||
| Axis/Level |
|
|
|
| |||||
| Level | Number of object's level.
| ||||
| Color(s) | Drawing colors as well as additional information (the parameters Color, Style, Width and Pattern in the |
| Detail dialog box). |
| Technical units | Technical units of the object (the parameter Units in the Detail dialog box). |
| Visibility | Informs about showing/hiding the parameters in the graph window. These parameters are checked in the Detail dialog box. |
| Description | Object description (parameter Description in the Detail |
| dialog box). |
Change order
The buttons  and
and  allow Hold and move the icon up/down
![]() to change the order of objects in the list. The order defined in the list will be displayed in the graph table.
to change the order of objects in the list. The order defined in the list will be displayed in the graph table.
...
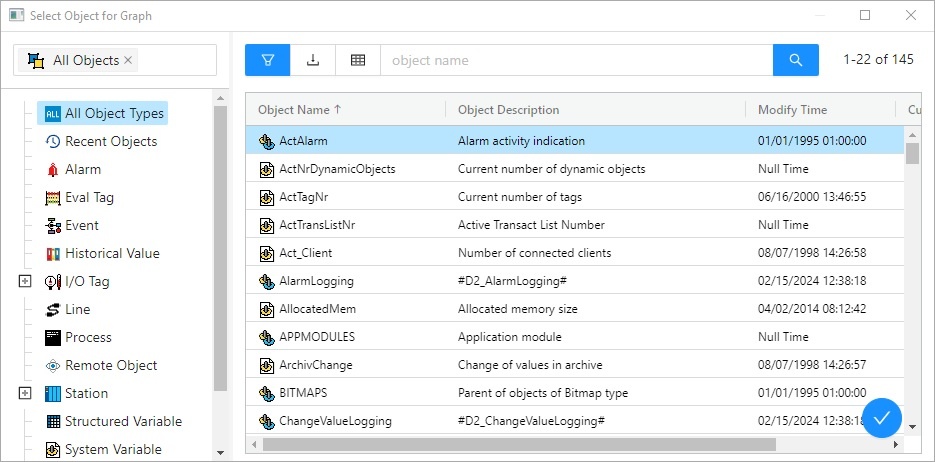
Add object
Allows to To add a new another object into the graph. Clicking , click the button opens the Object configuration dialog box that enables to ![]() button on the Objects tab. After double click on the Object name of selected object, the dialog box appears. It contains the list of every object that can be selected for the graph.
button on the Objects tab. After double click on the Object name of selected object, the dialog box appears. It contains the list of every object that can be selected for the graph.
Delete
The button ![]() deletes the selected object.
deletes the selected object.
Export
The button ![]() shows the list of option to export the list into TXT, CVS or PDF file.
shows the list of option to export the list into TXT, CVS or PDF file.
Configuration of selected object
To define settings for displaying the object values in the graph.
Edit
Dialog box Object configuration is opened by selecting of required object and clicking on Edit button, or double clicking of left mouse button on this object.
Point on the line, not Structured Array, can be edited by double clicking of right mouse button.
Delete
Deletes the selected object., open the dialog box Detail by double click on the left mouse button on each parameter (View, Type, Axis/Level, Color, ... ).
Note: The caption Active graph is displayed in the tab if at least one object of the list is active object (see the parameter Active graph object in the Object configuration dialog box).
| Info | ||
|---|---|---|
| ||