| Info |
|---|
Táto kapitola popisuje okno s novým používateľským rozhraním pre monitorovanie funkčné od verzie This chapter describes a window with a new user interface for monitoring functional from version D2000 12.2. V prípade potreby je možné D2000 HI spustiť s pôvodným používateľským rozhraním alarmov prostredníctvom parametra príkazového riadka /OLDUIIf required, the D2000 HI can be started with the original alarm user interface via the command line /OLDUI parameter |
| Obsah | ||
|---|---|---|
|
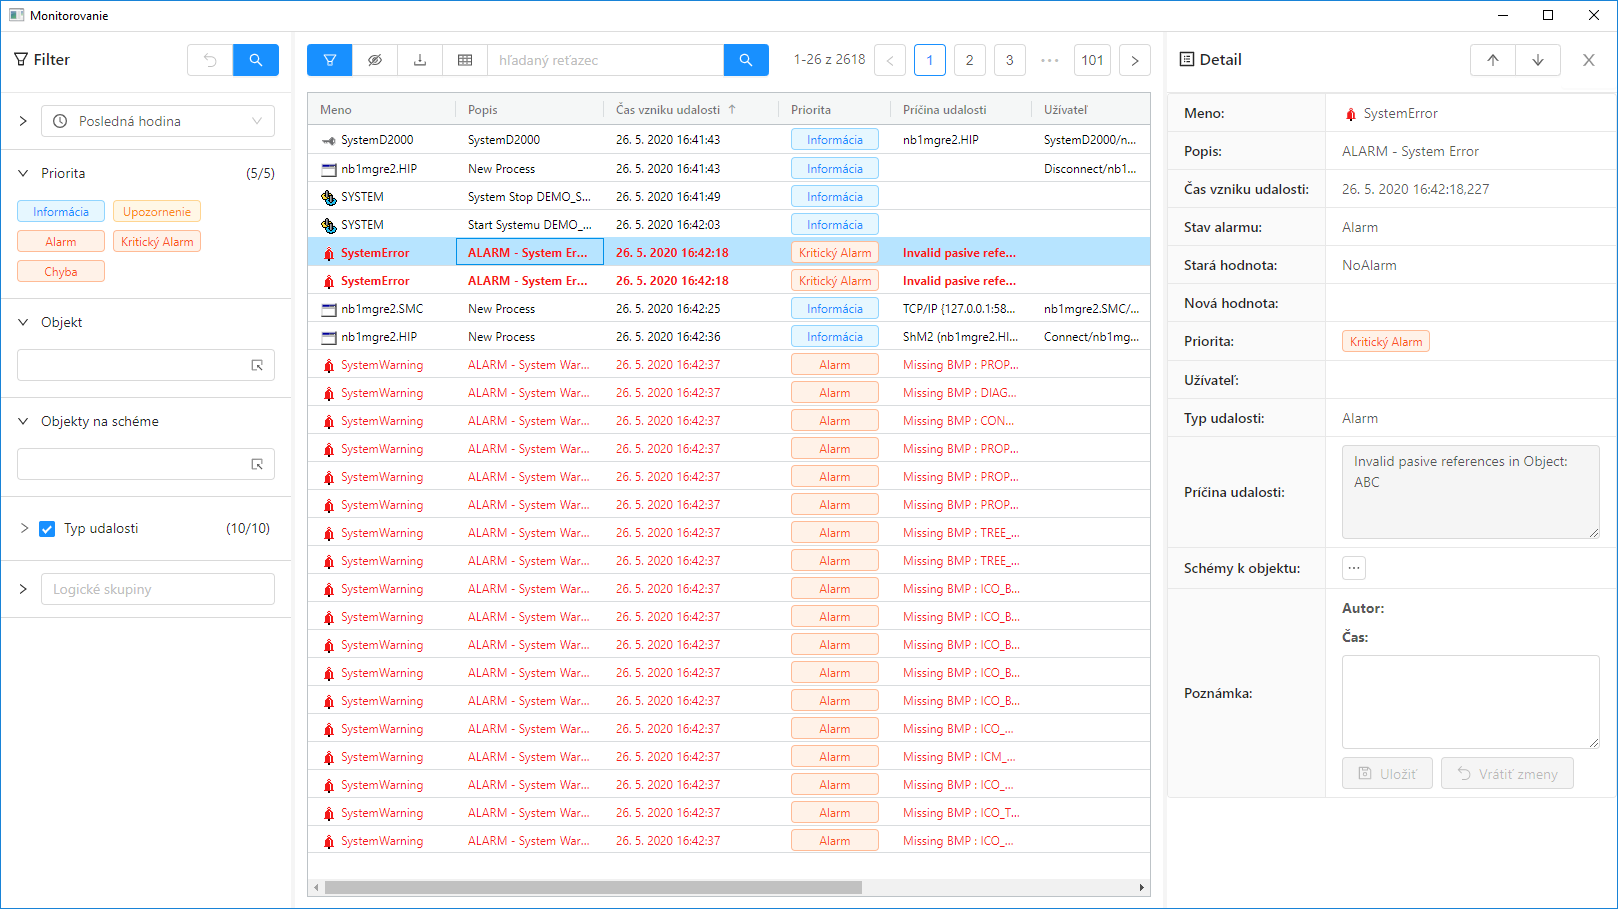
Okno Monitorovanie slúži na zobrazenie informácií z monitorovacej databázy. Skladá sa z troch častí - na ľavej strane sa nachádza skrývateľný panel pre filtrovanie monitorovaných udalostí systému zobrazovaných v tabuľke, ktorá tvorí centrálnu časť okna. V pravej časti okna sa po dvojkliku na riadok tabuľky zobrazí panel s detailnými informáciami vybranej monitorovanej udalosti. Konfigurácia filtra a aj nastavenia tabuľky sa automaticky ukladaju pri zatvorení okna pre daného užívateľa do registrov počítača. Preto pri znovuotvorení sa toto okno otvorí v stave v akom ho používateľ zatváral.
Úvodné zobrazenie okna
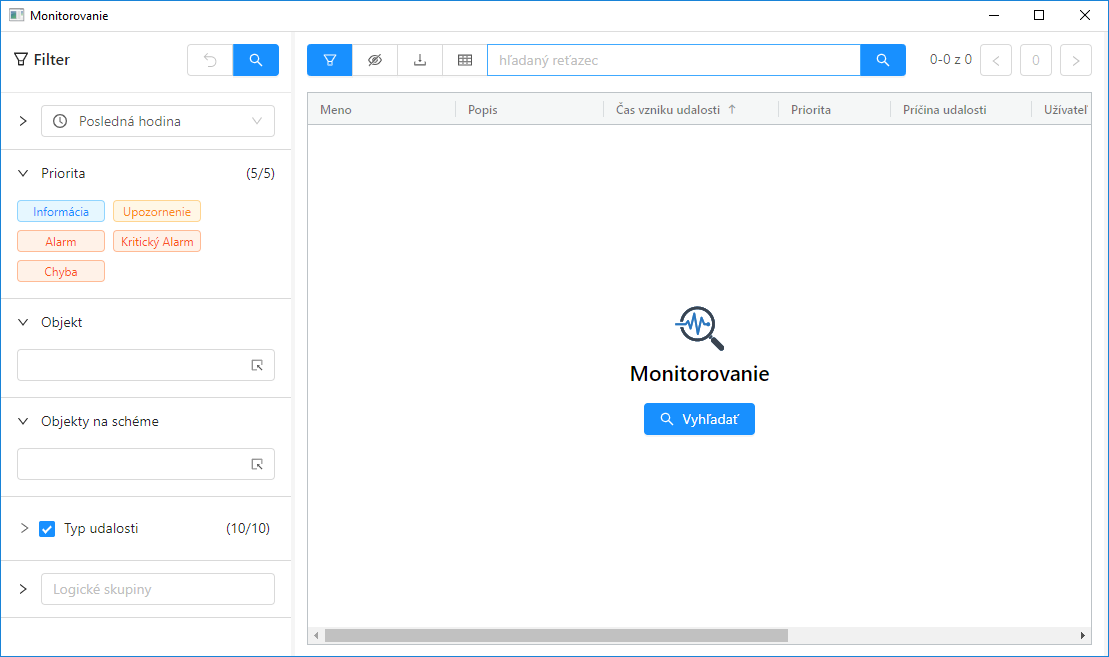
Po otvorení okna monitorovania sa automaticky nezobrazia údaje v tabuľke, ale je potrebné stlačiť akékoľvek tlačidlo s ikonou lupy na zobrazenie údajov. Dôvod tejto výnimky je kvôli tomu že načítanie údajov z monitorovacej databázy môže trvať dlhší čas (monitorovacia databáza môže byť napr. trezorovaná) čo by zbytočne mohlo spomaliť používateľa v prípade že filter záznamov nie je nastavený podľa jeho predstáv.
 Úvodné zobrazenie monitorovacieho okna
Panel Filter
Filtrovací panel na ľavej strane obrazovky slúži na definovanie požiadaviek pre zobrazenie informácií z monitorovacej databázy. V hlavičke panela sú prítomné dve tlačidlá. Prvé ![]() vracia nastavené atribúty filtra do povodného stavu, ktorý bol pri otvorení okna. Druhé tlačidlo
vracia nastavené atribúty filtra do povodného stavu, ktorý bol pri otvorení okna. Druhé tlačidlo ![]() vyvolá vyhľadanie záznamov podľa aktuálneho filtra a ich zobrazenie v tabuľke. Oranžová farba tohto tlačidla
vyvolá vyhľadanie záznamov podľa aktuálneho filtra a ich zobrazenie v tabuľke. Oranžová farba tohto tlačidla ![]() znamená že filter bol modifikovaný a je potrebné stlačiť tlačidlo aby sa výsledky zobrazili v tabuľke. Zmeny filtra sa teda automaticky neprejavujú v tabuľke, tak ako je to v prípade iných okien, ale je potrebné po zmene filtra vždy stlačiť toto tlačidlo (buď tu v zahlaví filtrovacieho panela alebo nad tabuľkou).
znamená že filter bol modifikovaný a je potrebné stlačiť tlačidlo aby sa výsledky zobrazili v tabuľke. Zmeny filtra sa teda automaticky neprejavujú v tabuľke, tak ako je to v prípade iných okien, ale je potrebné po zmene filtra vždy stlačiť toto tlačidlo (buď tu v zahlaví filtrovacieho panela alebo nad tabuľkou).
V hornej časti panela pod záhlavím sa nachádza výberovník časového intervalu ktorý umožňuje definovať časovú hĺbku pre zobrazenie údajov z monitorovacej databázy nasledovne:
- Posledná hodina – monitorovacie údaje za poslednú hodinu,
- Posledných 8 hodín – monitorovacie údaje za posledných 8 hodín,
- Posledných 12 hodín – monitorovacie údaje za posledných 12 hodín,
- Posledných 24 hodín – monitorovacie údaje za posledný deň,
- Vlastný interval – užívateľom definovaný časový interval pre zobrazenie monitorovacích údajov.
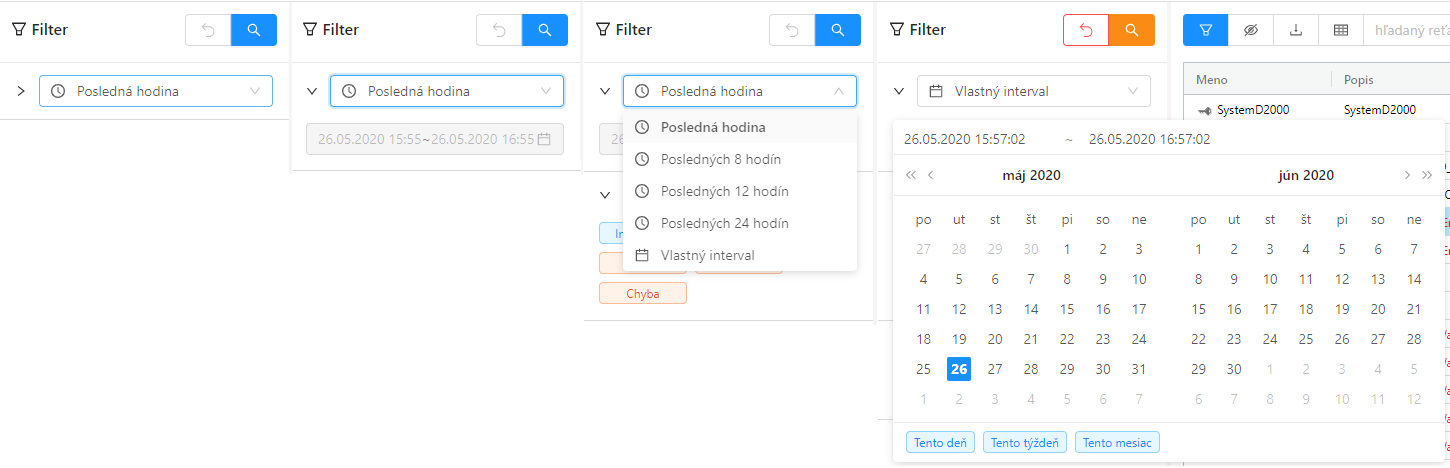
Pred výberovníkom intervalu sa nachádza rozbalovacie tlačidlo ![]() pre zobrazenie textového poľa s detailným časovým intervalom.
pre zobrazenie textového poľa s detailným časovým intervalom.
Po výbere možnosti "Vlastný interval" je možné do tohto poľa kliknúť a zadať interval ktorý použivateľ potrebuje.
Za výberovníkom času nasleduje klikateľný zoznam priorít monitorovaných udalostí ktoré sa majú filtrovať.
Zapnuté priority vypadajú nasledovne:![]()
Vypnuté (po kliknutí) vypadajú nasledovne: ![]()
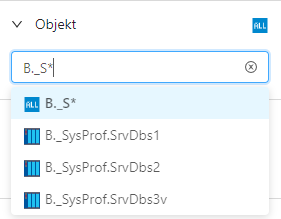
Výberovník objektu umožnuje filtrovať monitorovacie udalosti buď iba pre jeden vybraný objekt alebo je možné do neho zadať filtrovaciu masku.
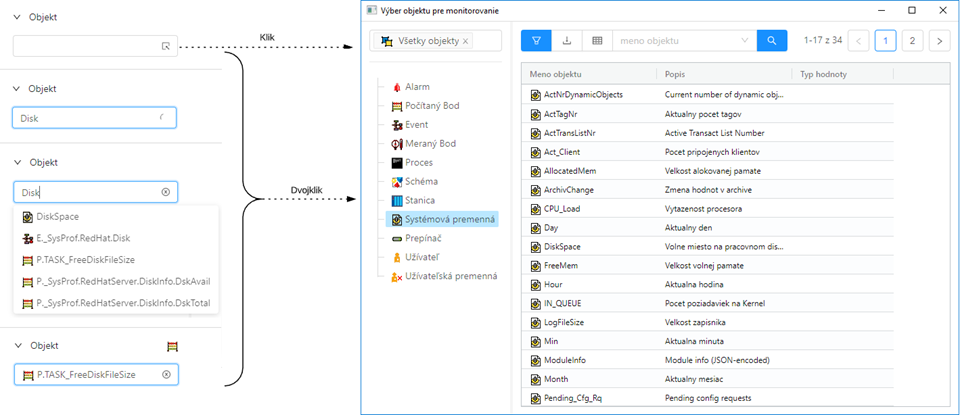
Pri písaní do výberovníka, automaticky sú navrhované objekty ktoré zadaný text obsahujú (v obrázku napravo).
V prípade ak používateľ potrebuje objekt vyhľadať, je možné kliknutím na ikonu na pravej strane výberovníka ![]() alebo dvojklikom otvoriť samostatné výberové okno s tabuľkou.
alebo dvojklikom otvoriť samostatné výberové okno s tabuľkou.
...
 Do výberovníka je možné písať aj vyhľadávaciu masku
Maska umožňuje zaradiť do zoznamu udalostí len tie objekty, ktorých mená majú určité spoločné znaky. V maske je možné použiť špeciálne znaky uvedené v nasledujúcej tabuľke.
...
The Monitoring window is used to display information from the log database. It consists of three parts - on the left side there is a hiding panel for filtering monitored system events displayed in a table that forms the central part of the window. In the right part of the window, after double-clicking on the table row, a panel with detailed information of the selected monitored event will be displayed. The filter configuration, as well as the table settings, are automatically saved in the computer's registers when the window for the given user is closed. Therefore, when reopened, this window will open in the state in which it was closed by the user.
Initial Window Display
After opening the monitoring window, the data in the table will not be displayed automatically, but it is necessary to press any button with a magnifying glass icon to display the data. The reason for this exception is because reading data from the log database may take longer (log database may be safe, for example), which could unnecessarily slow down the user if the record filter is not set according to his ideals.
Initial display of the monitoring window
Filter Panel
The filter panel on the left side of the screen is used to define the requirements for displaying information from the log database. There are two buttons in the panel header. The first ![]() returns the set attributes of the filter to the original state that was when the window was opened. The second button
returns the set attributes of the filter to the original state that was when the window was opened. The second button ![]() calls up the search for records according to the current filter and their display in the table. The orange colour of this button
calls up the search for records according to the current filter and their display in the table. The orange colour of this button ![]() means that the filter has been modified and it is necessary to press the button to display the results in the table. Therefore, filter changes are not automatically reflected in the table, as is the case with other windows, but it is necessary to always press this button after changing the filter (either here in the header of the filter panel or above the table).
means that the filter has been modified and it is necessary to press the button to display the results in the table. Therefore, filter changes are not automatically reflected in the table, as is the case with other windows, but it is necessary to always press this button after changing the filter (either here in the header of the filter panel or above the table).
At the top of the panel below the header, there is a time interval selector that allows you to define the time depth for displaying data from the log database as follows:
- Last hour - monitoring data for the last hour,
- Last 8 hours - monitoring data for the last 8 hours,
- Last 12 hours - monitoring data for the last 12 hours,
- Last 24 hours - monitoring data for the last day,
- Custom interval - user-defined time interval for displaying monitoring data.
In front of the interval selector, there is a drop-down![]() button to display a text box with a detailed time interval.
button to display a text box with a detailed time interval.
After selecting the "Custom interval" option, it is possible to click in this field and enter the interval that the user needs.
The time selector is followed by a clickable list of priorities for monitored events, which are to be to be filtered.
Enabled priorities look like this:![]()
Disabled (after clicking) look like this: ![]()
The object selector allows you to filter monitoring events either for only one selected object or to enter a filter mask in it.
When writing in the selection box, objects that contain the entered text are automatically suggested (in the image on the right).
If the user needs to search for an object, it is possible to open a separate selection window with a table by clicking on the icon ![]() on the right side of the selection box or by double-clicking.
on the right side of the selection box or by double-clicking.
| Kotva | ||||
|---|---|---|---|---|
|
It is possible to write a search mask in the selection box
The mask allows you to include in the list of events only those objects whose names have certain common features. The special characters listed in the following table can be used in the mask.
| Character | The Meaning of the character |
|---|---|
| * | Replaces any number of characters. |
| ? | Replaces one character. |
| [characters] | Allows you to specify several characters (without a delimiter) that may appear in a specific position. |
| [^characters] | Allows you to specify several characters (without a delimiter) that cannot appear in a specific position. |
If the first character in the mask is an exclamation mark (!), the mask will be evaluated as a Perl compatible regular expression. For example, the expression HAk je prvým znakom v maske znak výkričník (!), maska bude vyhodnotená ako Perl kompatibilný regulárny výraz. Napríklad výraz H..CESA* AND (*.TEPL.* OR *.TEPL_* OR *_TEPL_*) je možné zapísať ako can be written as !^H\.\.CESA.*((\.TEPL\.)|(\.TEPL_)|(_TEPL_)). V monitorovaní nie je možné filtrovať záznamy využitím masky s operátormi AND a OR. Avšak prepisom do regulárneho výrazu je toho možné za určitých okolností dosiahnuť.
Výberovník schémy umožnuje filtrovať monitorovacie udalosti iba pre objekty nachádzajúce sa na danej schéme. Výberovník funguje analogicky ako výberovník objektov, ale v tomto prípade ponúka na výber iba schémy (filtrovacia maska sa tu nedá zadať).
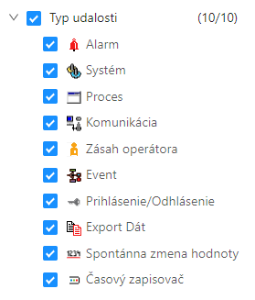
Strom typov udalosti umožňuje filtrovať záznamy podľa typu udalosti. Na výber sú tieto skupiny udalostí:
...
In monitoring, it is not possible to filter records using a mask with AND and OR operators. However, by transcribing into a regular expression, this can be achieved under certain circumstances.
The scheme selector allows you to filter monitoring events only for objects located on the scheme. The selector works analogously to the object selector, but in this case, it only offers schemes for selection (a filter mask cannot be entered here).
The event type tree allows you to filter records by event type. The following groups of events are available:
| Alarm | All changes of alarm states - origin, vanishing, acknowledgement, etc. |
| System | Start and stop of the system. |
| Process | All process state changes - start, stop and crash. |
| Communication | Communication errors. |
| Operator intervention | Operator interventions in the D2000 HI process. |
| Event | Event entries. |
| Login / Logout | Login and logout of the operator in individual processes of the system. |
| Data export | Export of data from monitored tables. |
| Spontaneous value change | Spontaneous change of the value of the object type switch, disconnector without operator intervention (circuit breaker tripping). |
| Time recorder | Special data from communication. |
 Event type tree
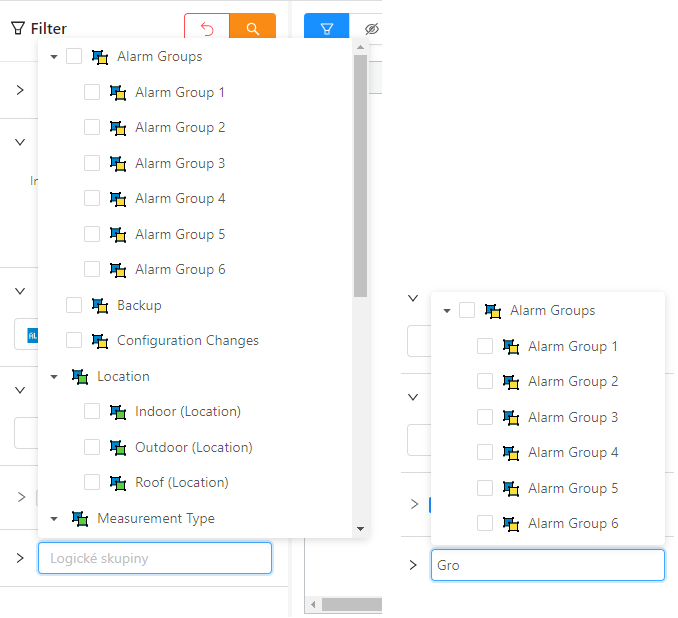
The last part of the filter panel offers event filtering of those objects that are included in the selected logical groups. After clicking in the text box, a popup will appear with a tree of all logical groups. Checking the checkbox on the left for each logical group selects it in the filtered list. The displayed tree is automatically filtered according to the text written in the text field - this way it is easy to search the tree.
The selector with a tree of logical groups and search in this tree.
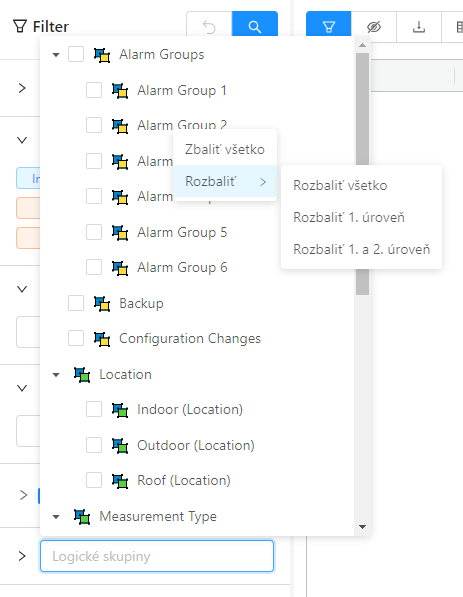
With the right button on any logical group, it is possible to call up a context menu with the option to collapse or expand the tree to a certain level. Initially, the tree is always fully expanded, but after selecting a specific option to collapse or expand, the last setting is recorded in the window configuration - that is, when the window is opened again, the tree will be expanded according to the last setting from this menu.
 Context menu of the logical group tree
Table
The table shows the monitoring records, in the way that all records are loaded into the table at the beginning. The internal limit is currently about 10 thousand records, if more data was recorded in the selected time interval, the user is informed by a popup with a warning that not all records for the given filter conditions have been read - i.e. only part of the records are displayed. In this case, it is necessary to define more detailed filter conditions in the filter panel to reduce the number of records. The quick search box above the table only searches for records that have already been loaded.
Strom typov udalostí
Posledná časť filtračného panela ponuka filtrovanie udalostí tých objektov, ktoré sú zaradené do vybraných logických skupín. Po kliknutí do textového poľa sa zobrazí popup so stromom všetkých logických skupín. Zaškrtnutím checkboxu naľavo pri každej logickej skupine sa táto vyberie do filtrovaného zoznamu. Zobrazený strom sa automaticky filtruje podľa textu písaného do textového poľa - týmto spôsobom je jednoducho možné v strome vyhľadávať.
Výberovník so stromom logických skupín a vyhľadávanie v tomto strome.
Pravým tlačidlom na ľubovolnej logickej skupine je možné vyvolať kontextové menu s možnosťami zbalenia alebo rozbalenia stromu do určitej úrovne. Iniciálne je strom vždy celý rozbaleny, ale po výbere konkrétnej možnosti zbalenia alebo rozbalenia sa posledné nastavenie zaznamenáva do konfigurácie okna - to znamena pri novom otvorení okna bude strom rozbalený podľa posledného nastavenia z tohto menu.
Kontextové menu stromu logických skupín
Tabuľka
Tabuľka zobrazuje monitorovacie záznamy, sposobom že sa všetky záznamy načítajú do tabuľky na začiatku. Interný limit je momentálne cca 10 tisíc záznamov, pokiaľ sa vo vybranom časovom intervale zaznamenalo viac údajov, používateľ je informovaný popupom s varovanim že nie všetky záznamy pre dané filtračné podmienky boli načítané - t.j. zobrazuje sa iba časť záznamov. V tomto prípade je potrebné definovať detailnejšie filtračné podmienky vo filtračnom paneli, aby sa počet záznamov zmenšil. Rýchle vyhľadávacie pole nad tabuľkou vyhľadáva iba v už načítaných záznamoch.
| Info |
|---|
Všeobecné funkcionality tabuľky sú popísané v samostatnej kapitole Všeobecné ovládanie tabuľky v novom používateľskom rozhraní. |
Tabuľka obsahuje nasledovné stĺpce:
The general functionalities of the table are described in a separate General table control in the new user interface chapter. |
The table contains the following columns:
| Column | Column contents | ||||||
|---|---|---|---|---|---|---|---|
| Name | The name of the D2000 system object to which the event relates + a graphic symbol representing the group of monitored events. | ||||||
| Description | Description of the event. | ||||||
| Alarm status (the column is initially hidden in the monitoring window) | Object alarm status after an event (only if the event is of the alarm type) | ||||||
| Event formation time | Formation date and time of the event. If the msec option is checked, the column displays time data to the nearest millisecond. | ||||||
| Priority | Priority indicates the severity of the event. The following five priority levels are implemented in the system (in order from smallest to largest):
| ||||||
| Stĺpec | Obsah stĺpca | ||||||
| Meno | Meno objektu systému D2000, ktorého sa týka daná udalosť + grafický symbol znázorňujúci skupinu monitorovaných udalostí. | ||||||
| Popis | Popis danej udalosti. | ||||||
| Stav alarmu (stĺpec je v monitorovacom okne inicialne skrytý) | Stav alarmu objektu po udalosti (iba v prípade ak udalosť je typu alarm) | ||||||
| Čas vzniku udalosti | Dátum a čas vzniku udalosti. Ak je začiarknutá voľba msec, stĺpec zobrazuje časové údaje s presnosťou na milisekundy. | ||||||
| Priorita | Priorita (dôležitosť) indikuje závažnosť udalosti. V systéme je zavedených týchto päť úrovní priority (v poradí od najmenšej po najväčšiu):
| ||||||
The cause of the event | The cause of the monitored event. In the case of an event of type *LOG* New value *Logon* - i.e. the user's login contains:
V prípade udalosti typu *LOG* Nová hodnota *Logon* - teda prihlásenie užívateľa obsahuje:
For example: The user logged in to the NB1.CNF použitím Remote Desktopu z pracovnej stanice sprocess using Remote Desktop from a workstation with IP=172.16.1.134. Na pracovnej stanici bol prítomný HW kľúč s jednoznačným identifikátorom = 480. Na serveri, kde proces fyzicky bežal, bol prítomný HW kľúč s jednoznačným identifikátorom = 917. | ||||||
| Užívateľ | Meno operátora prihláseného v čase výskytu danej udalosti (pri procesoch je v tomto stĺpci uvedené "Connect" alebo "Disconnect").
| ||||||
| Stará hodnota | Hodnota objektu pred udalosťou. | ||||||
Nová hodnota | Hodnota objektu po udalosti. | ||||||
An HW key with a unique identifier = 480 was present on the workstation. An HW key with a unique identifier = 917 was present on the server where the process was physically running. | |||||||
| User | The name of the operator logged in at the time of the event (for processes, "Connect" or "Disconnect" is listed in this column).
| ||||||
| Old value | The value of the object before the event. | ||||||
New value | The value of the object after the event. | ||||||
| Event type | Type of monitored event:
| Typ udalosti | Typ monitorovanej udalosti:
| ||||
| Object Id objektu (skrytý stĺpechidden column) | HOBJ identifikátor objektu udalosti | ||||||
| Poznámka (skrytý stĺpec) | Text poznámky ktorý zadal používateľ pre danú udalosť | ||||||
| Čas poznámky (skrytý stĺpec) | Časová značka poslednej modifikácie poznámky | ||||||
| Autor poznámky (skrytý stĺpec) | Autor poslednej modifikácie poznámky | ||||||
| Stĺpce atribútových logických skupín (skryté stĺpce) | Logicke skupiny označené ako atribútové sa automaticky stávajú aj stĺpcami tejto tabuľky. Mená logických skupín ktoré su potomkami tejto atributovej logickej skupiny (child v strome) sa zobrazujú v riadkoch jednotlivých monitorovaných záznamov tých objektov ktoré patria do týchto logických skupín. |
V zozname je možné usporiadať dáta podľa ľubovolného stĺpca, implicitne je to však stĺpec Čas vzniku udalosti. Nové hodnoty sa dopĺňajú pre vzostupné usporiadanie na neúplnú poslednú stránku a pre zostupné na prvú stránku zoznamu.
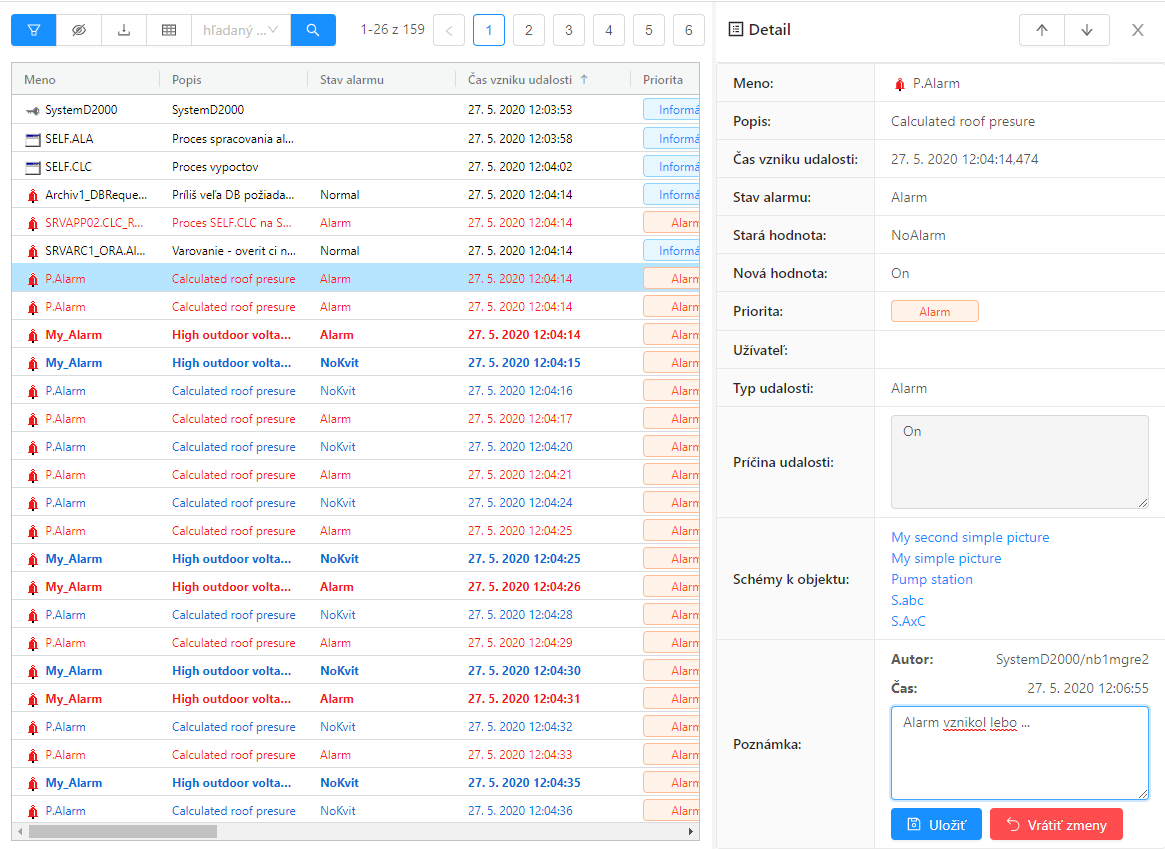
Panel s detailom monitorovanej udalosti
Dvojité kliknutie myši na ľubovoľný riadok v tabuľke (zozname) otvorí panel s detailom udalosti. Tento panel prehľadne zobrazí všetky informácie z tabuľky o tomto riadku. Zobrazenie je výhodné v prípade dlhých informácií v jednotlivých stĺpcoch. Pohyb po riadkoch v tabuľke umožňujú šípky nachádzajúce sa v záhlaví panela. Panel vždy zobrazuje informácie o aktuálne vybranom zázname.
Okrem zobrazených informácii sa v tomto detaile monitorovanej udalosti dá zobraziť zoznam schém na ktorých je objekt (jeho hodnota) zobrazený. Tento zoznam schém (viď položka Schémy k objektu v obrázku nižšie) sa nenačítava hneď ale najskor sa na miesto neho zobrazí tľačidlo ![]() na ktoré je potrebné kliknúť. Zoznam schém je vo forme klikateľných liniek (v prípade ak má schéma vypnený popis, zobrazí sa ten a nie meno schémy). Kliknutím na konkrétnu schému sa táto v HI otvori.
na ktoré je potrebné kliknúť. Zoznam schém je vo forme klikateľných liniek (v prípade ak má schéma vypnený popis, zobrazí sa ten a nie meno schémy). Kliknutím na konkrétnu schému sa táto v HI otvori.
Okrem zoznamu schém je používateľ schopný zadať poznámku ku monitorovanej udalosti (položka poznámka v obrázku nižšie), ktorou môže bližšie popísať detaily udalosti. Meno používateľa ako aj čas poslednej modifikácie sa s polu textom poznámky uložia do databázy po stlačení tlačidla Uložiť na konci panela
| identifier of the event object | |
| Note (hidden column) | The text of the note entered by the user for the event |
| Note time (hidden column) | Timestamp of the last modification of the note |
| Author's notes (hidden column) | Author of the last modification of the note |
| Columns of attribute logical groups (hidden columns) | Logical groups marked as attributes automatically become columns of this table as well. The names of logical groups that are descendants of this attribute logical group (child in the tree) are displayed in the rows of individual monitored records of those objects that belong to these logical groups. |
In the list, you can arrange the data by any column, but by default, it is the Event Formation Time column. New values are added for ascending order to incomplete last page and for descending to the first page of the list
Panel with Detail of the Monitored Event
Double-clicking on any row in the table (list) will open a panel with the event detail. This panel clearly displays all the information from the table about this row. The display is useful for long information in individual columns. The arrows in the header of the panel allow you to move through the rows in the table. The panel always displays information about the currently selected record.
In addition to the displayed information, a list of schemes on which the object (its value) is displayed can be displayed in this detail of the monitored event. This list of diagrams (see the item Schemes for the object in the picture below) is not loaded immediately, but first, a ![]() button will appear in its place, which must be clicked on. The list of schemes is in the form of clickable lines (in case the scheme has the description turned off, it will be displayed and not the name of the scheme). Clicking on a specific scheme will open it in HI.
button will appear in its place, which must be clicked on. The list of schemes is in the form of clickable lines (in case the scheme has the description turned off, it will be displayed and not the name of the scheme). Clicking on a specific scheme will open it in HI.
In addition to the list of schemes, the user is able to enter a note on the monitored event (note item in the image below), which can describe the details of the event in more detail. The username, as well as the time of the last modification, is saved in the database with the text field of the note after pressing the Save button at the end of the panel.
Panel with detail of the monitored eventPanel s detailom monitorovanej udalosti