"
...
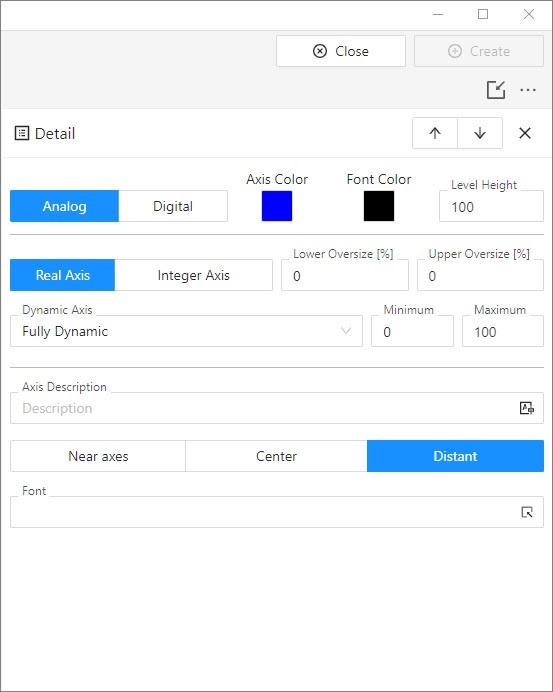
Detail" dialog box
A dialog window is intended for a configuration of axes in a graph. A number placed in the header represents the axis sequential number.Order of the axes is changed by buttons  .
.

Number
Axis serial number is automatically generated during the axis creation. The number is one figure greater than the sequential number of the last axis. You can define up to 99 axes.
| Kotva | ||||
|---|---|---|---|---|
|
Axis may be analog or digital one according to the type of displayed values. Analog axis is used for objects of numeric types (integer and real/analog) and digital axis is used for objects of Boolean type. Digital axis is also used for a graphic flow of Strip graph type.
| Kotva | ||||
|---|---|---|---|---|
|
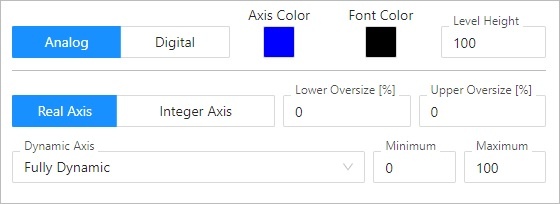
The following input fields appear in the dialog box after selecting the radio button Analog axis:

| Kotva | ||||
|---|---|---|---|---|
|
Axis and Font color is chosen from the color palette opened after clicking on the arrow button placed beside Axis color item.
| Kotva | ||||
|---|---|---|---|---|
|
Level height defines a level height ratio to height of other levels. User sets aliquot coefficient for drawing area division for levels according to axis so that the demands of displayed axes are counted and level height is divided by sum. A gained result relating to one part is multiplied by its demand for displayed area.
This parameter is valid for axial levels, not for object levelsThe parameters Minimum and Maximum allows to define limits for the analog axis. If minimum is higher than maximum, axis will be drawn upside down. The graphic flows are drawn upside down, too. A special axis description is supported - with defined range of 360, the limits start from -360, -180, 0, 180, 360.
Axis type
- Real - has no restrictions for calculating the axis range
- Integer - has the calculation of boundaries rounded to integers and has a minimum range of 1.0
...
Analog axis may be dynamic one – – Dynamic axis item item. The range of dynamic axis (minimal and maximal limits) in the displayed graph is automatically modified according to range changes of the displayed object values. The possible types of dynamic axis:
- Static- inactive dynamic axis
- Fully dynamic dynamic - fully dynamic axis with no limits
- Dynamic minimum minimum - axis with dynamic minimum and static maximum
- Dynamic maximum maximum - axis with dynamic maximum and static minimum
- Dynamic with min. range - dynamic axis with defined minimal range
- Dynamic symmetric min/max - dynamic axis with bounds symmetric around zero
- Dynamic with min difference - dynamic axis with minimum distance of maximal and minimal limit given by difference between maximum and minimum in configuration of the axis.
Dynamic axis - Overlap (D2000 V12.7N)
Dynamic axes can have a defined overlap. Overlap is a value calculated from the range of displayed values that belong to the respective axis. It is added to the minimum and maximum value before calculating the axis boundaries. The following applies:
Ymin = MinY(Data) - ( MaxY(Data) – MinY(Data) ) * dolný presah / 100 100 [%])
Ymax = MaxY(Data) + ( MaxY(Data) – MinY(Data) ) * horný presah / 100 100 [%])
The parameters Minimum and Maximum allows to define limits for the analog axis. If minimum is higher than maximum, axis will be drawn upside down. The graphic flows are drawn upside down, too. A special axis description is supported - with defined range of 360, the limits start from -360, -180, 0, 180, 360. The specified values are also used for dynamic axes in case where the dynamic range cannot be calculated.
| Kotva | ||||
|---|---|---|---|---|
|
The following controls appear in the dialog box after selecting the radio button Digital axis:
Number of levels
...
- No level
- Used levels
- All levels
...
Level height defines a level height ratio to height of other levels. User sets aliquot coefficient for drawing area division for levels according to axis so that the demands of displayed axes are counted and level height is divided by sum. A gained result relating to one part is multiplied by its demand for displayed area.
This parameter is valid for axial levels, not for object levels.
...
| Kotva | ||||
|---|---|---|---|---|
|
Name of the Y-axis (vertical). It is displayed in the graph area. Possibility to use the Dictionary (to open press CTRL+L).
...
- Y axis: Near axis, Center, Distant.
If text overlaps, only text for left axis is displayed.
If axis placed on the left and on the right side is identical, only description for left axis is displayed. - X axis: Near axis, Center, Right

Requirements
| Minimum supported version | D2000 V12.7N |
| Info | ||
|---|---|---|
| ||
...