...
Basic parameters of the graph are being defined in the Graph configuration dialog box - Parameters tab.

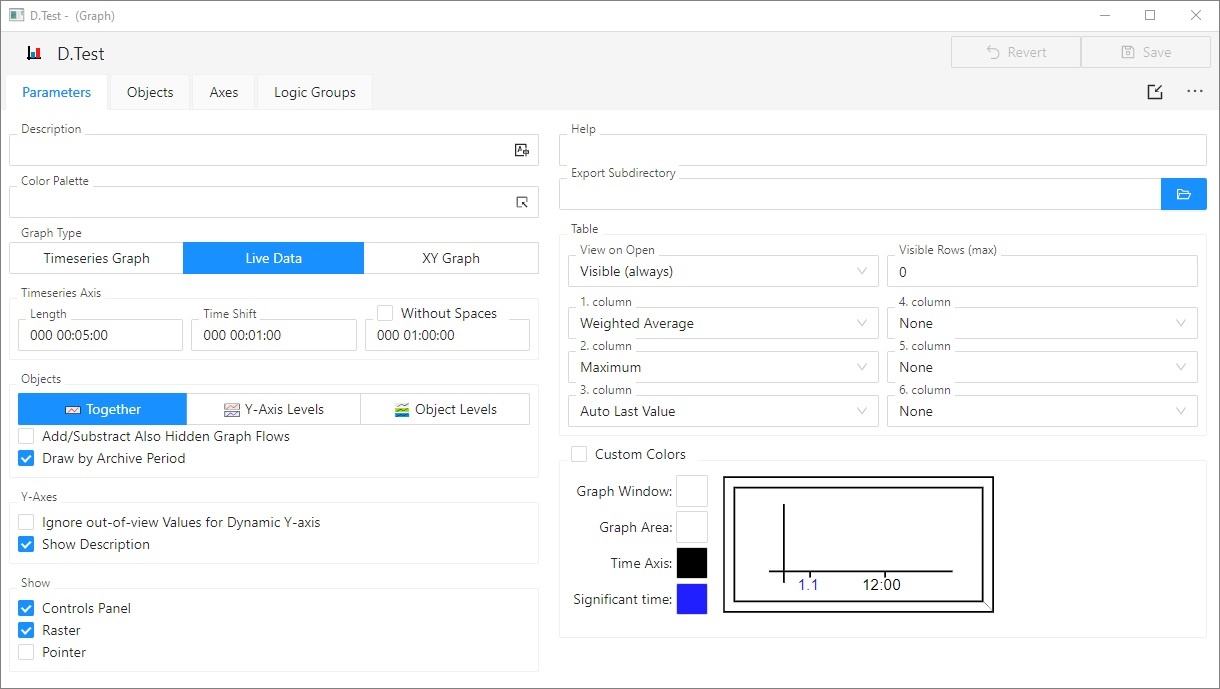
Description
A text string describing the graph. Description along with the name will be displayed in the list of graphs.
Possibility to use the Dictionary (to open press CTRL+L).
...
First way enables to hide / show the table after clicking ![]() . It is indicated by grey / yellow color of table icon in the graph. The second one enables to hide the table after the graph window is reduced, which is indicated by dark grey / red color of icon.
. It is indicated by grey / yellow color of table icon in the graph. The second one enables to hide the table after the graph window is reduced, which is indicated by dark grey / red color of icon.
...
- Minimum - minimum object value within the time interval defined for the graph
- Auto Minimum - minimum object value within the time interval defined for the graph - the column is visible only when graph displays the non-live data (the parameter Live data is not checked or when user sets the past by button
 New time interval)
 - Maximum - maximum object value within the time interval defined for the graph
- Auto Maximum - maximum object value within the time interval defined for the graph - the column is visible only when graph displays the non-live data (the parameter Live data is not checked or when user sets the past by button New time interval)
- Sum - sum of all valid object values within the time interval defined for the graph
- Weighted Average - weighted average of all valid object values within the time interval defined for the graph
- Arithmetic Average - arithmetic average of all valid object values within the time interval defined for the graph
- Last Value - last object value
- Auto Last Value - last object value - the column is visible only when graph displays the live data (the parameter Live data is checked) and graph changes because of new data are received
- Universal - content of the column is defined by the parameter U.C. in the object configuration or the function %HI_SetGraphLineStat
...