EDA debugger is used for debugging the calculation of calculated vectors and functions of the EDA subsystem. This feature is included in a group of graphic objects for pictures as an EDA debugger.
This graphic object enables, directly in its interface, to connect to any EDA calculation in the application. Calculation means loading of calculated vector or calculation of function. The whole process of debugging is controlled in the graphical interface, i.e. in the EDA debugger.
Another method of usage of EDA debugger is the initiation of calculation for debugging directly from ESL script. This method requires supporting functions of the EDA debugger. In the first step, the user must create a debugging connection with the process that executes EDA calculations. To establish this connection, use the function %HI_EDADebugOpen. The function %HI_EDADebugClose closes this connection. After creating debug connection, the user may start the calculation of the calculated vector for debugging by calling the function %HI_EDADebugVectorRec. When calling %HI_EDADebugCalcFunctionRec, it activates debugging calculation of the EDA-L formula. Functions %HI_EDADebugVectorRec and %HI_EDADebugCalcFunctionRec do not wait for finishing the calculation that was started by these functions.
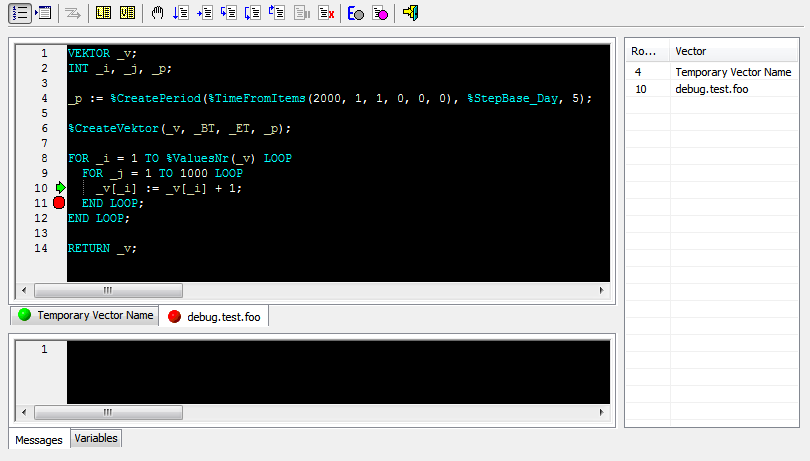
Example of an EDA debugger that is used in a picture opened in HI:
It consists of:
- Toolbar – contains buttons that represent debug commands.
- Tabs with calculations – contains source formulas of vector calculation.
- Info tabs:
- Messages – contains messages that have been generated during calculation.
- Variables – contains monitored variables of selected vector.
- Call stack – contains the current list of nested vectors of aborted calculation.
Toolbar
Buttons represent the commands that control debugging of calculations.
| Enable/disable the numbering of rows in the formula. | |
| Go to row in displayed vector. | |
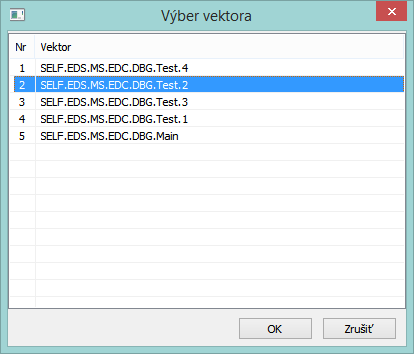
Connect to calculation – connection to running calculation which should be debugged. Dialog window displays the list of all running EDA calculations in the application with information such as on which EDA server the calculation runs, from which client was started, and the initiate vector that is calculated. | |
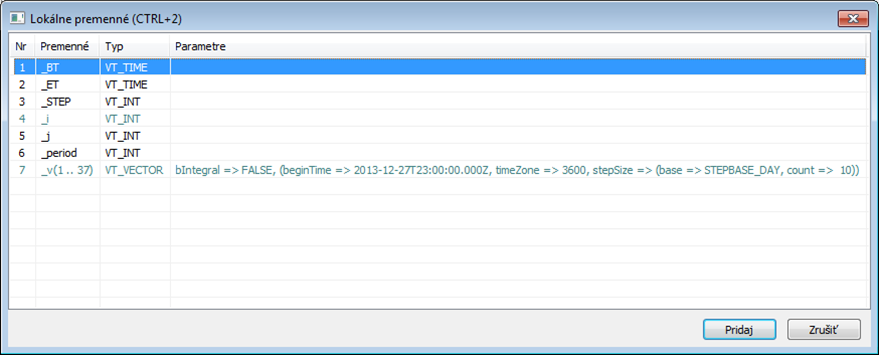
| List of local variables in displayed vector - enables to add variables into Variable tab. | |
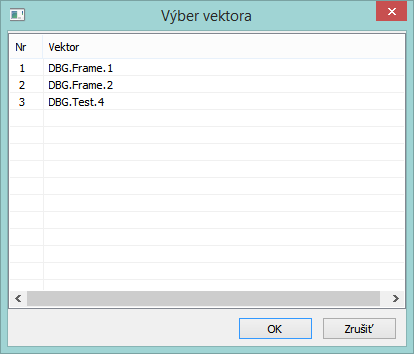
List of vectors used when debugging (closed vector included) – enables to open (select) vector which will be displayed. | |
The icon which informs about the status of calculation:
| |
| Continue in the calculation. | |
| Continue in calculation up to row with the cursor (if on the row is not any script command, calculation continues up to next row with command). | |
| Step inside – if the row contains loading of the calculated vector, the process continues within it. | |
| Step outside – if the row contains loading of calculated vector, loading is executed and calculation stops on the next row. | |
| Continue up to return from the vector. | |
| Abort calculation. | |
| Stop calculation. | |
Aborted when occurring an exception – indicates two statuses differentiated by color:
| |
| Delete all breaks in all vectors. | |
| Finish calculation debugging (calculation will continue). |
Tabs with calculation
Tabs contains the vector formulas that were used when debugging connected calculations. Vector formula occurs in tabs automatically after aborting the calculation - tabs contain all vectors that are in the current call stack. Users may manually close (hide) the tab with the vector formula and then open it again (via the list of vectors).
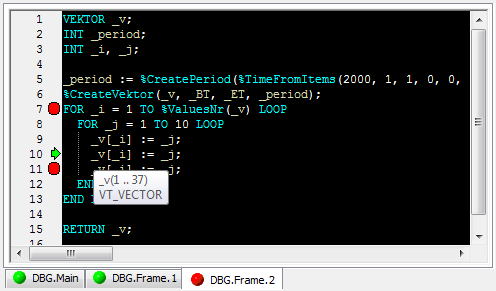
Tabs show the name and version of the vector and indicate its status (3 options):
- Grey circle – vector, at the time of aborting calculation, does not occur in the call stack.
- Green circle – vector, at the time of aborting calculation, occurs in the current call stack.
- Red circle – vector, at the time of aborting calculation, occurs in the current call stack and contains a command that will be executed.
Tab with vector formula
It contains:
- Optional row numbering
- Breakpoints – red circles
- Mark for aborting the execution of calculation – green arrow
- Vector formula with syntax highlighting:
- key words and functions – turquoise color,
- local variable – yellow color,
- delimiters – white color.
- Description of variable and its value (for one-element variables) with the cursor.
Popup menu that occurs over formula enables:
- to add a selected local variable into the list of watched variables of vector,
- to hide tabs of vector – watching variables and breakpoints stays activated. Tabs may be displayed again via the list of vectors.
Info tabs
Messages
The tab contains the messages that were generated during the calculation. Users may write some notes in the tab and delete the selected texts.
Variable
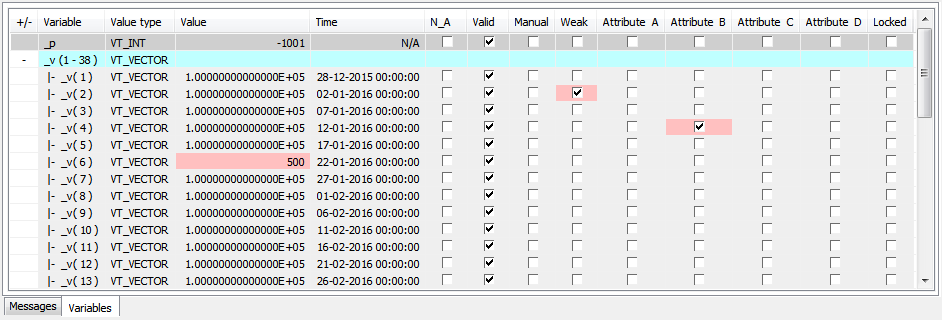
The tab that contains the values of watched local variables of selected vector. The sign +/- collapses/expands the vector variables.
It is filled from the list of local variables via the command line or popup menu that appears over the selected variable in the window with the vector formula.
Variables, the values of which are already watched, are differentiated by color (turquoise color). Selecting the variable of Array type, the user may enter a range of values that will be watched:
Selection may be defined by range and name. To display the items to the last one, enter the zero at the end of the range, e.g. 3,11-14,18,25-0.
The monitored variable/group of variables can be removed from the list with the help of a popup menu. The value can be changed directly in the list of watched variables.
A Popup menu that appears over the list of variables enables to:
- remove selected variable/group of variables,
- remove all variables,
- define new values for variables,
- delete the change of the value of selected variables.
Call stack
The call stack displays the current list of vector nesting of aborted calculations. The first vector of the calculation is at the top of the list. Double-clicking over the list enables you to select the tab with the vector formula. The row, on which the calculation was aborted, will be selected automatically.
Example of starting calculation of vector for debugging from the script
 INT _serverId, _clientId
 INT _retCode

 ENTRY BTN_DebugVectorRec_OnClick
  RECORD NOALIAS (SD._System_HI_EDADebugVectorRec) _paramsRec
  TIME _bt, _et

 ; connection to process that executes EDA calculations
  _retCode := %HI_EDADebugOpen(_DBG, _serverId, _clientId)

 _bt := %StrToTimeEx("2015-01-01 00:00:00", "rrrr-mm-dd hh:mi:ss")
 _et := %StrToTimeEx("2015-02-01 00:00:00", "rrrr-mm-dd hh:mi:ss")
 _paramsRec[1]^structVersion := 1

 ; activating calculation of vector for debugging
 _retCode := %HI_EDADebugVectorRec(_DBG, "DBG.Main", _bt, _et, _paramsRec\HBJ)
 END BTN_DebugVectorRec_OnClick

 ENTRY BTN_DebugClose_OnClick
 ; closing debug connection
 _retCode := %HI_EDADebugClose(_DBG)
 END BTN_DebugClose_OnClick

 BEGIN
 ; getting ID of process EDA Client, which uses this HI, and EDA Server, to which the client is connected
 ; it is expected that connection to EDA already exists
 CALL %EDA_GetProcessId(_serverId, _clientId, _retCode)
 END
Related pages:








0 komentárov